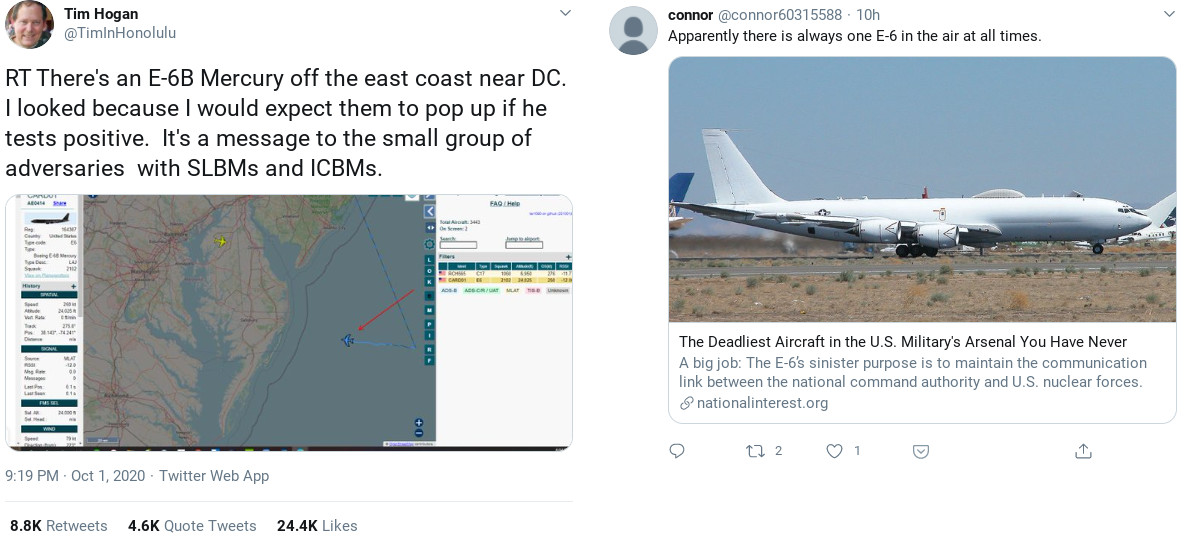
One of the weirder news stories that came out when Trump announced he had COVID-19 was that the US's doomsday planes are now hovering, poised to send out missile launch commands to submarines. It looks like this started when someone on twitter noticed that some of the US's Boeing E-6B planes were heading out to the oceans on the east and west coasts, and that these planes are the mobile command centers for coordinating with submarines. Twitter and Fox did what they do best and went off the rails trying to figure out what this all means. Fortunately, plane spotters like Christiaan Triebert and others properly dumped flight histories to show that these flights actually happen all the time. I didn't know anything about these planes so I spent the morning reading wikipedia and looking through my data to see if I could find them. Yep! There are some in CA and they do show up all the time! Relax.
Boeing E-6 Mercury Planes
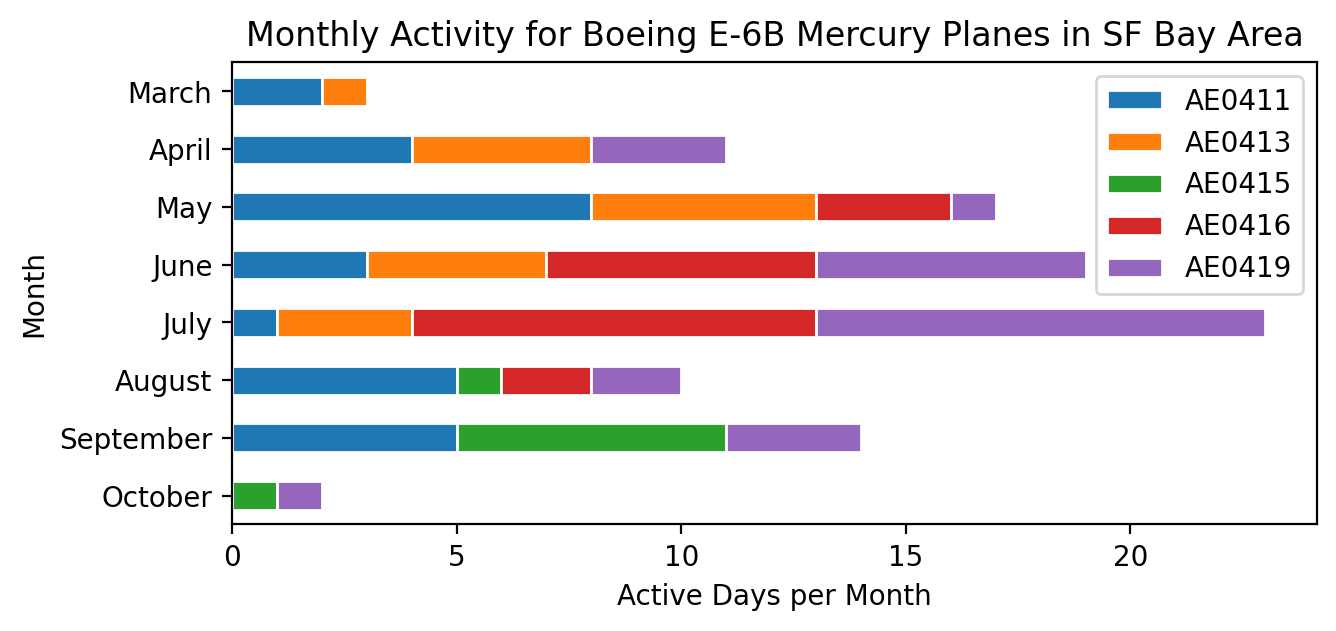
From Wikipedia, the Boeing E-6 Mercury is a variant of the Boeing 707 that was made for the military to provide communication among resources in case ground systems are wiped out. There are 16 of these planes in use, and from ADS-B.NL you can learn that their ICAO ids are AE040D-AE041C (conveniently sequential in the military ICAO range). I've been leaving my flight tracker on all the time since the outbreak so I did some greps on my recent data. Sure enough, I found some hits in yesterday's data. Digging through all my data and plugging it into pandas yielded the below breakdown of how many days each plane flew near me over the last few months.
As the above shows, I saw five different E-6 planes, with some of them being active as many as 10 days out of the month. While the tracker was up a lot of the time, there were some gaps in March, August, and September (the tracker crashed without me knowing it for a week; I powered it off for a few days when the garage was over 110 degrees; we had a few power outages during the fires).
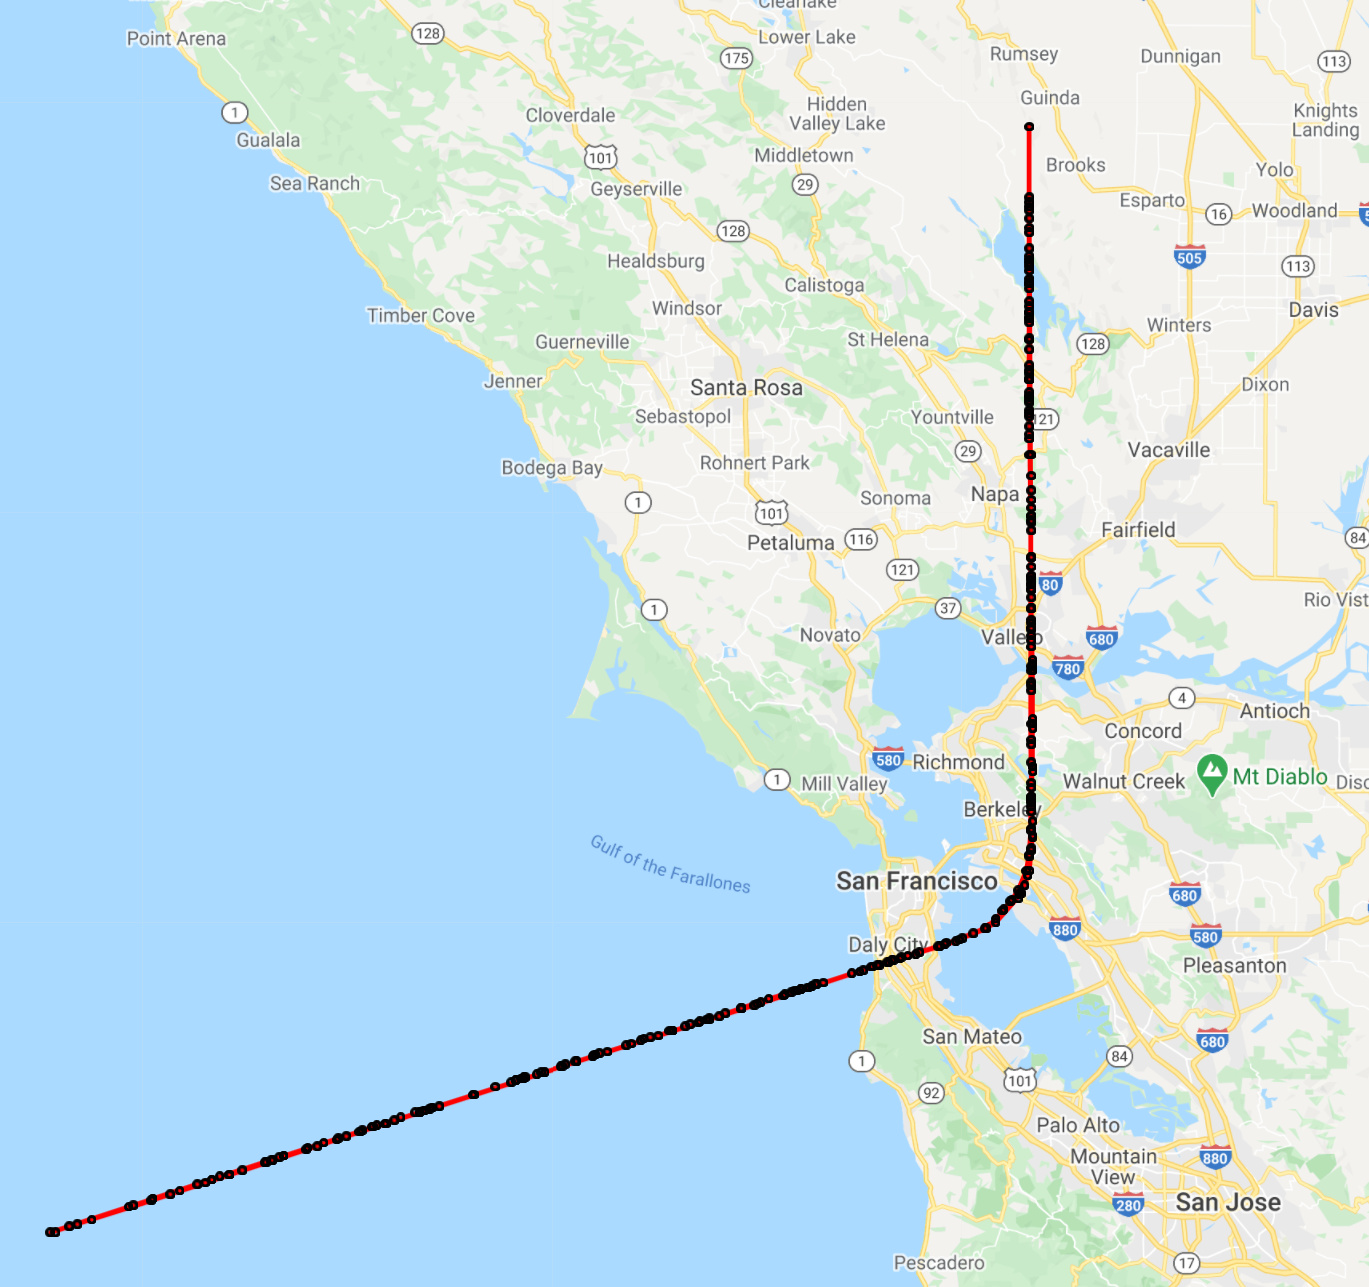
Heading out to Sea
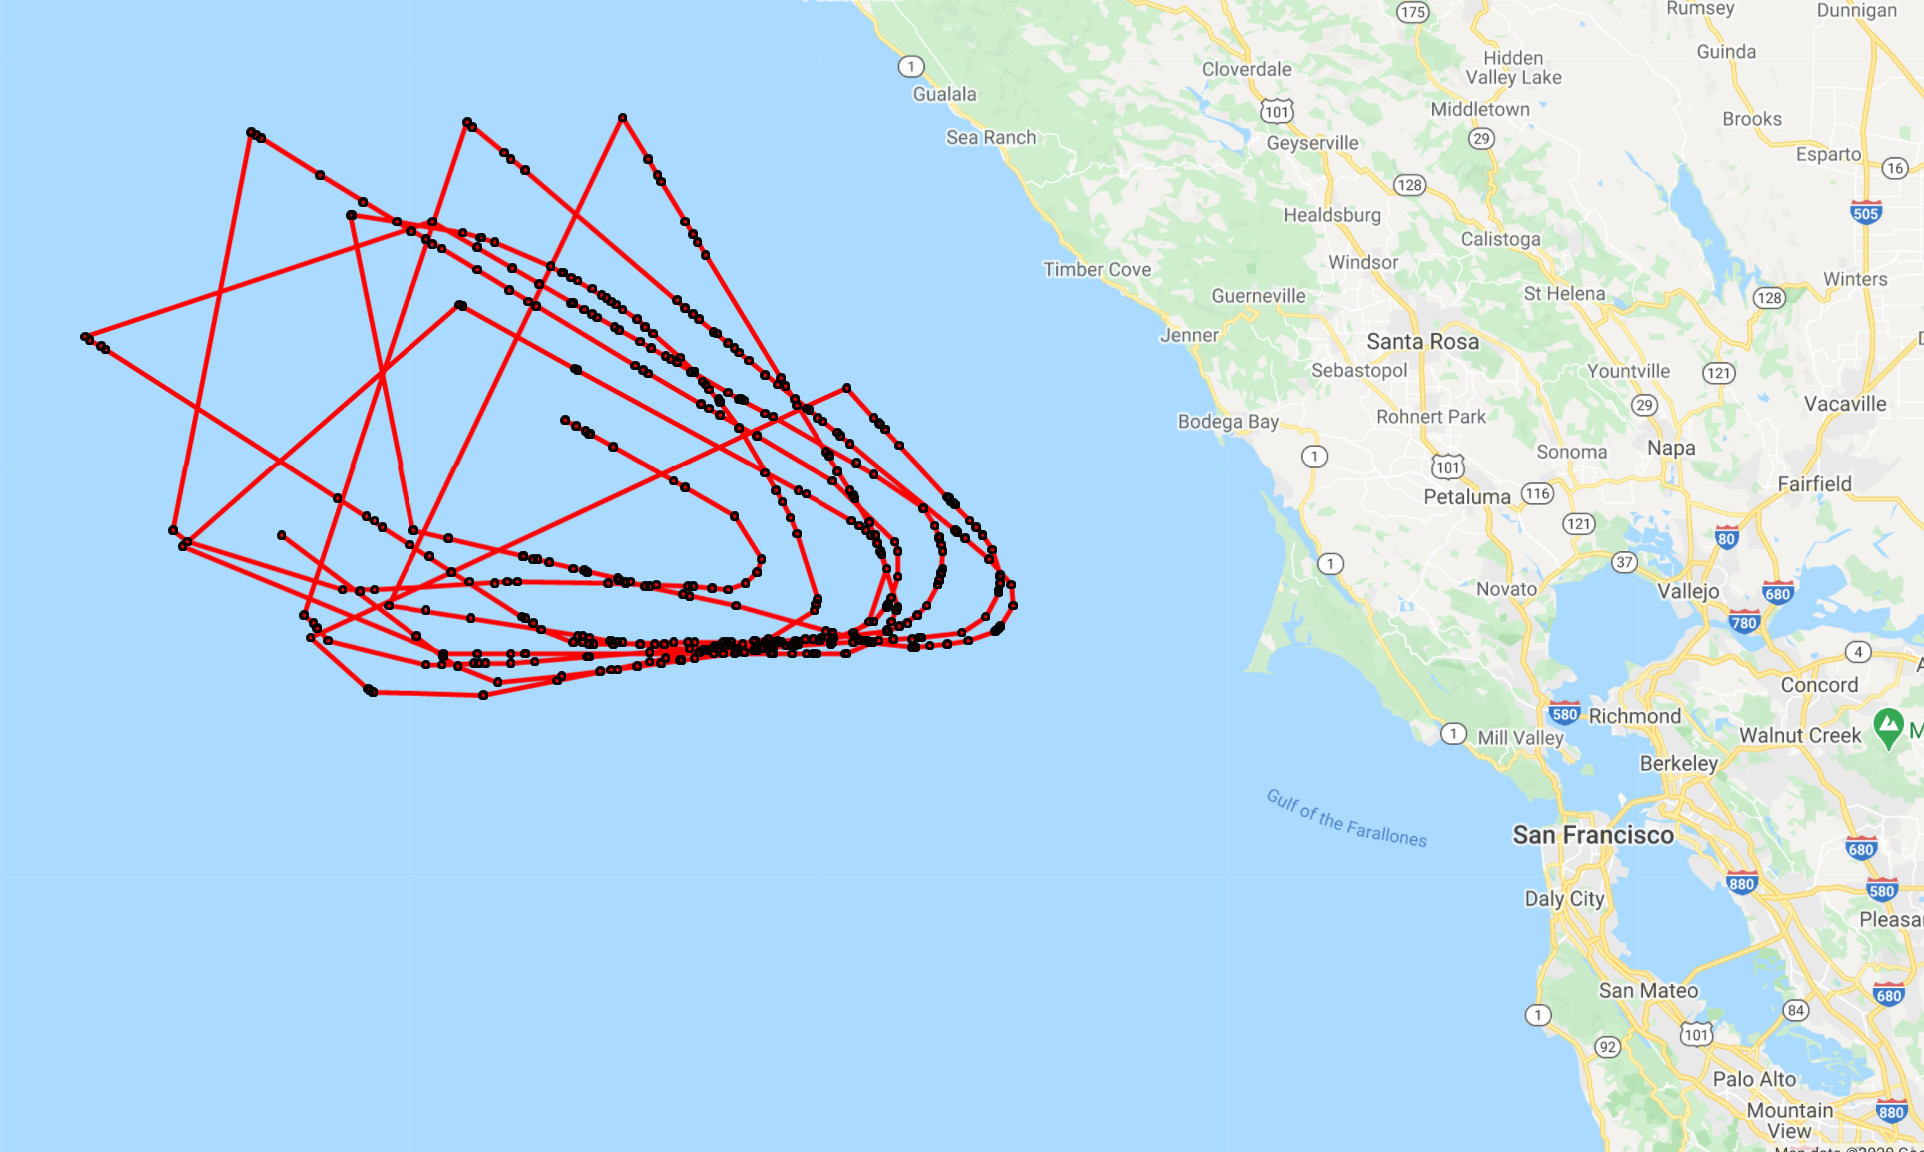
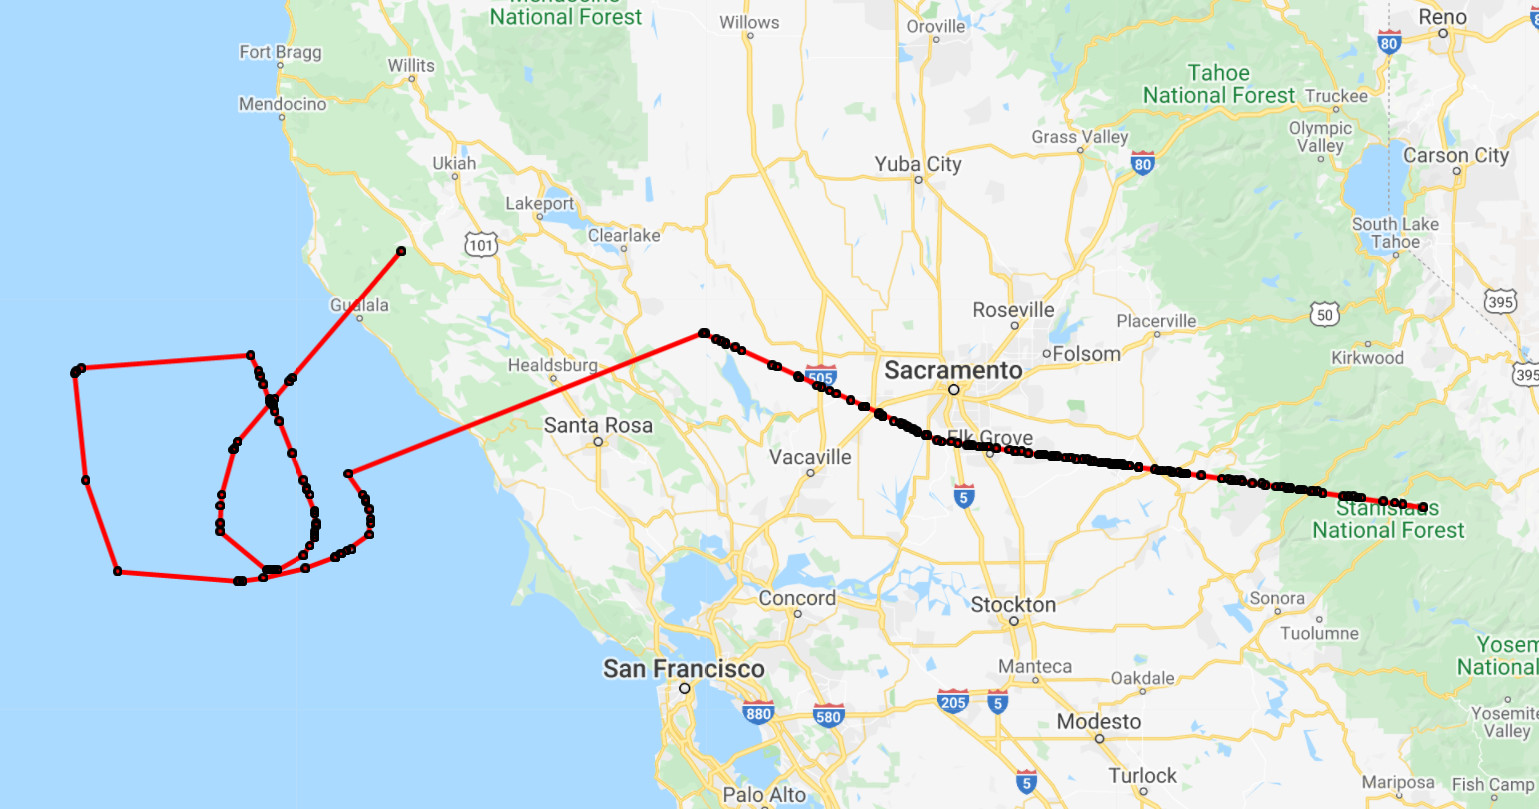
Looking through the tracks, there are several instances where the planes fly out to sea and circle around a lot. The following tracks are from July 26, August 13, and September 14. As these tracks show, flying out to sea is not an uncommon event.
Information is Surprise
Information theory elegantly defines "information" as a measurement of how much surprise is in the data. Things that happen all the time are not news. Unusual events are. Reporting on these "doomsday planes" without giving some background info is providing news- but the news for most people is just that the US has these planes at all. Taking a broader look at the data you find that these flights do not seem to be related to Trump's health, and that we don't need to assume the worst just yet.
Looking at the fire-fighting helicopter data made me wonder what other helicopters fly around our area. I didn't know if there was an identifier that the FAA uses to distinguish planes from helicopters, but when I looked at the FAA site I noticed that they had a database field that designated whether the aircraft was for government use or not. I skimmed through the list of aircraft registered in Alameda and found the following gov planes: two sheriff's cesnas (N10CX and N5525U), three Oakland police helicopters (N220PD, N330PD, and N510PD), and two helicopters registered to the East-Bay Regional Park District (N708PD and N996PD). I didn't know the EBRPD had helicopters, but thinking about it it's not surprising. EBRPD manages parks all over the bay area, many of which are far off into the hills. Their operations page talks about how they use the helicopters to support police tasks, fight fires (they have their own water buckets), and do rescue work (I've thought about this on some of the long bike rides I've done with the kids back into Morgan Territory).
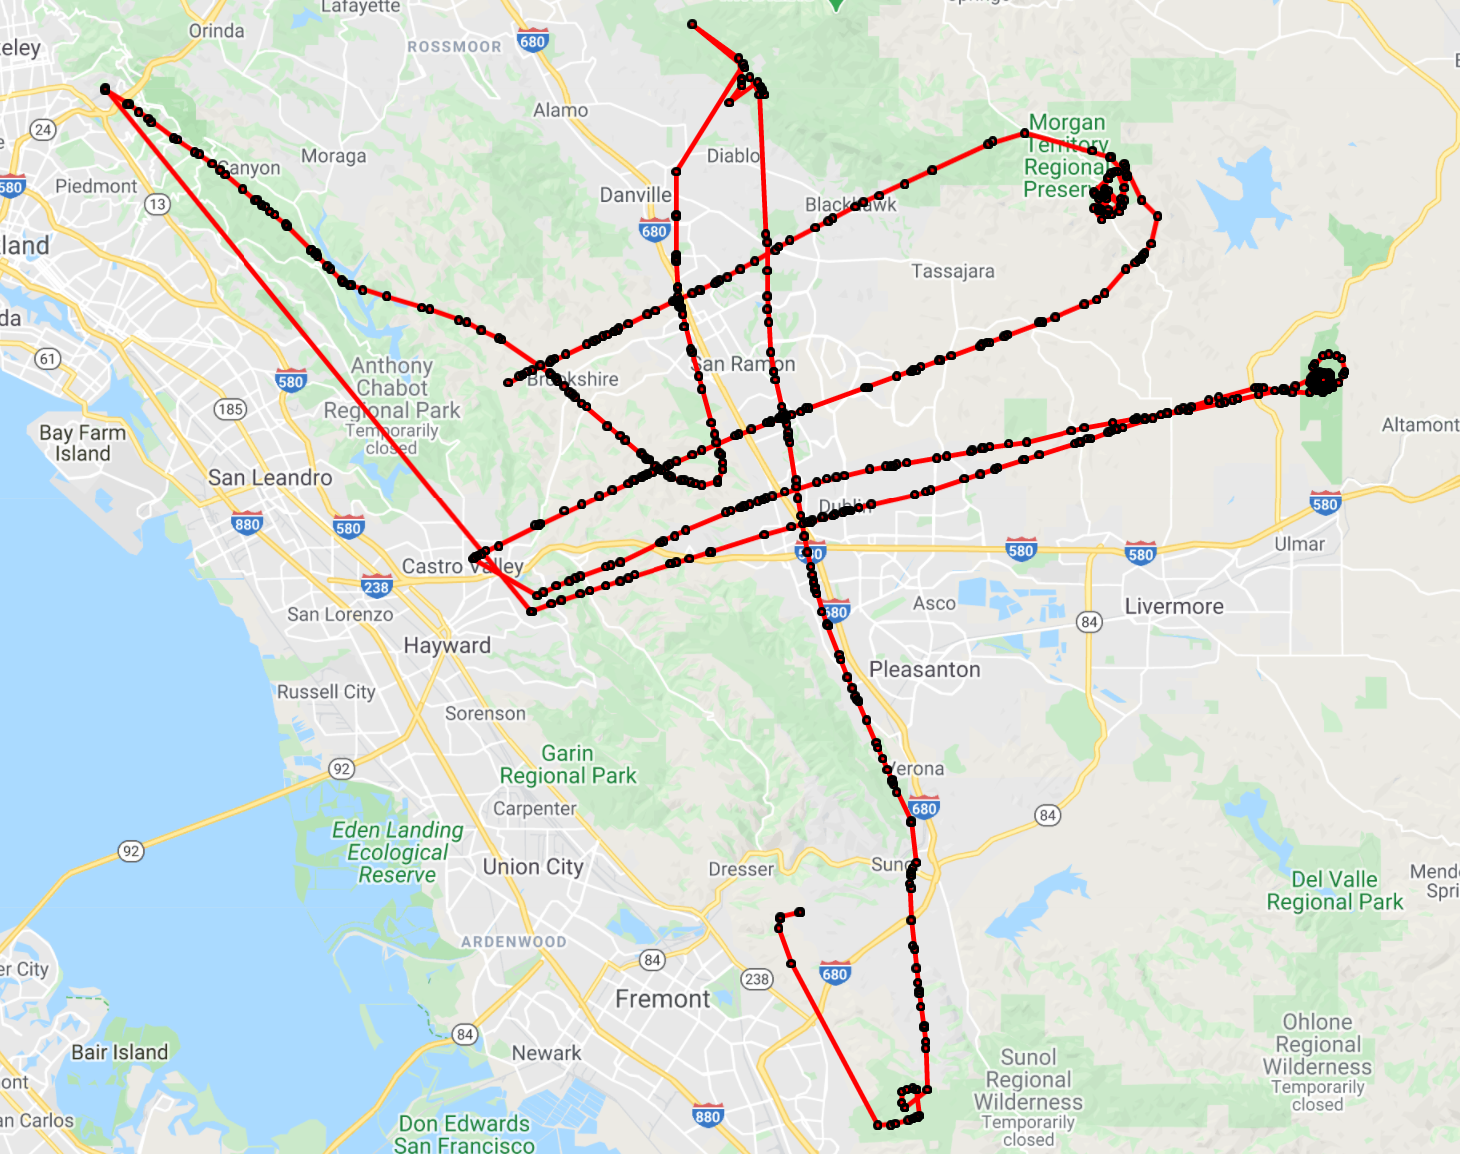
Fire Inspections
Looking through my flight data I found that the EBRPD helicopters are sent out periodically to check on the different parks. The fires from the lightning strikes the other week have been awful though, so it looks like the EBRPD helicopters have been doing more flights over the areas. The below track from September 5th shows how they go out to Chabot, Morgan Territory, Diablo, Sunol, the Pleasanton Ridge, and Brushy Peak.
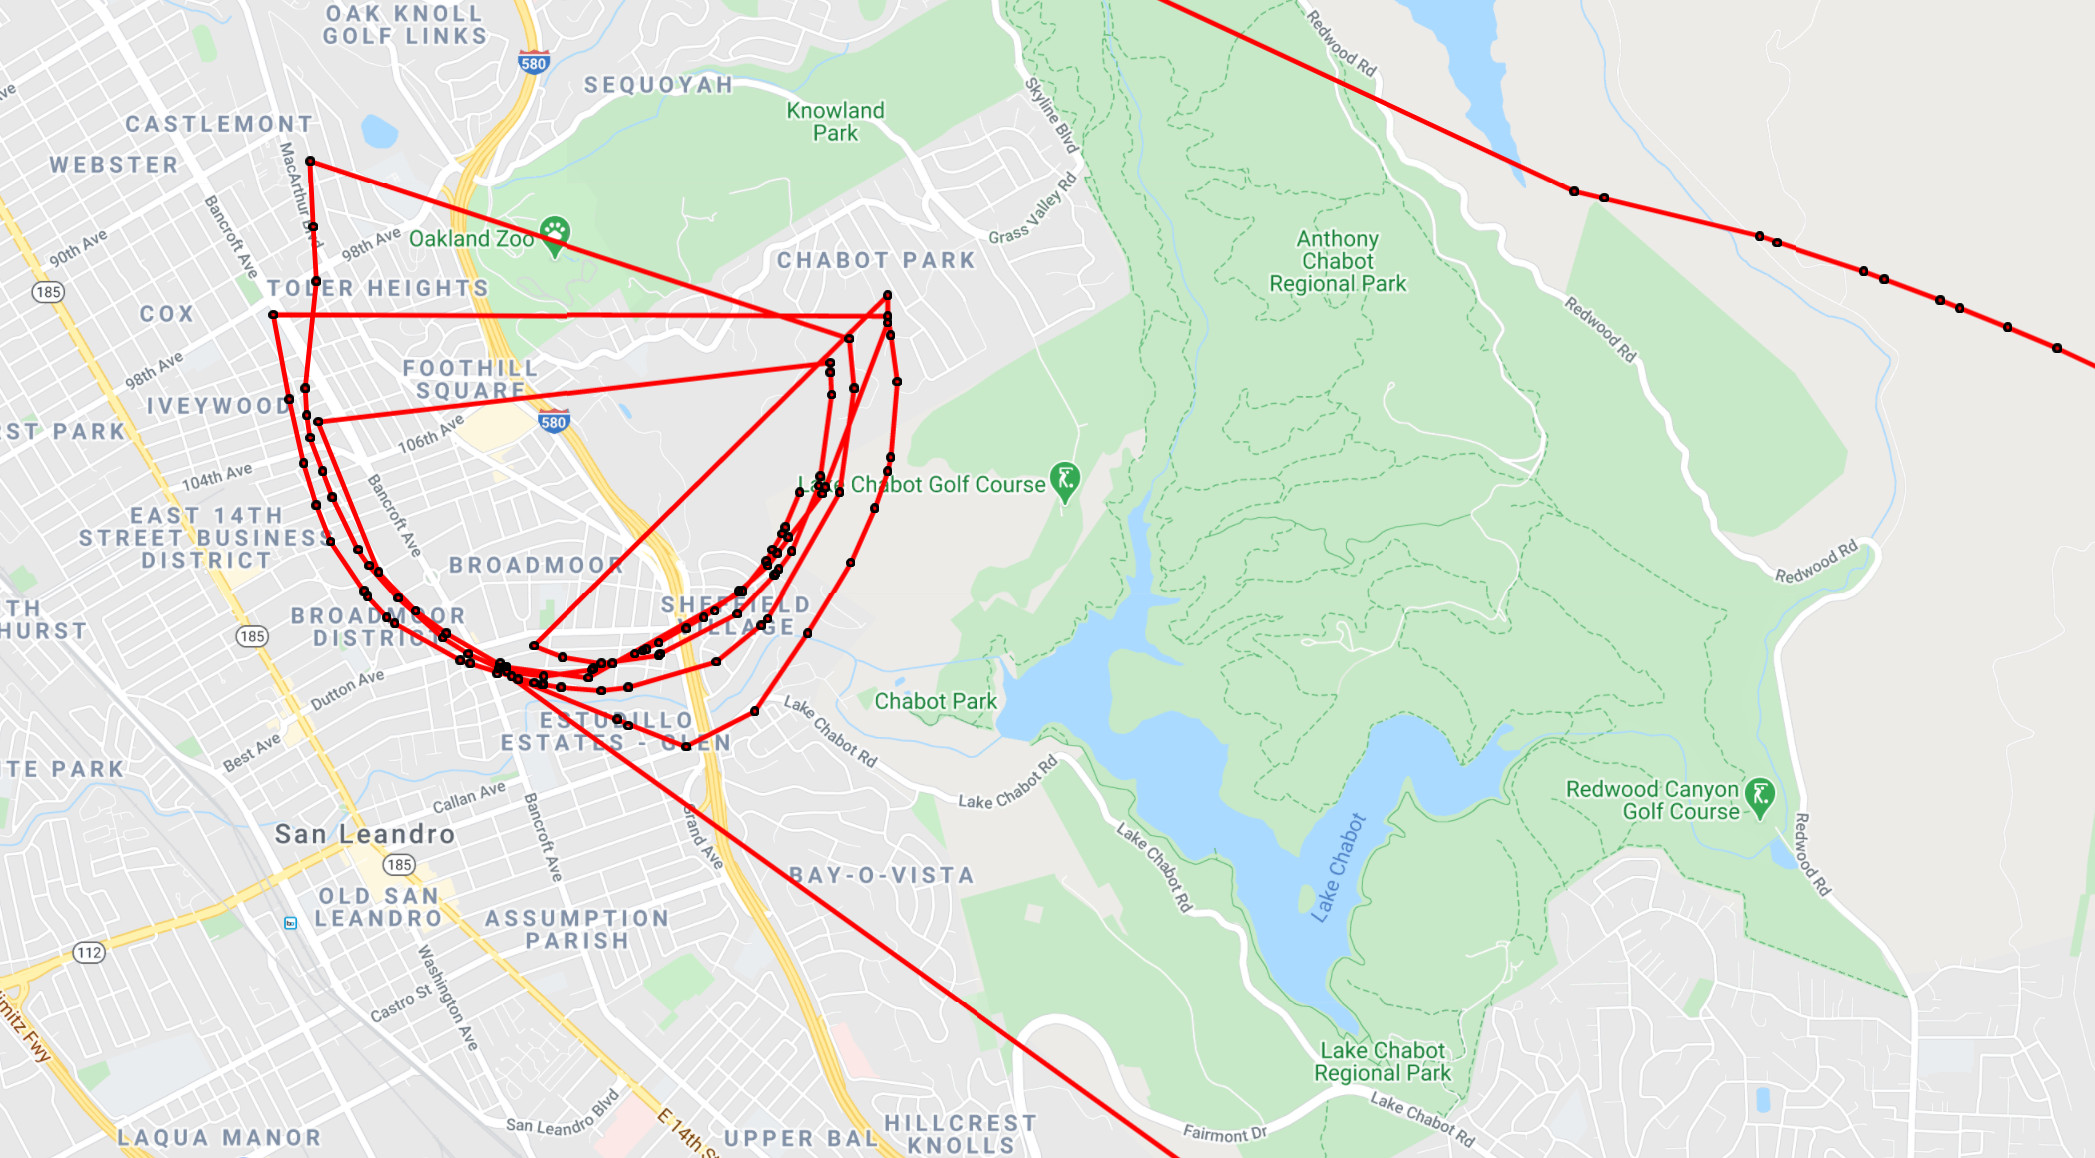
Police Activity
Looking through the data some more I spotted a few of the Oakland Police Department helicopters. So far, these usually seem to fly out from Oakland to check things out along the interstate, but sometimes they seem to be circling some activity like the below (maybe something was happening at the Oakland Zoo?). One of the interesting things about all this is that while they broadcast their location over ADSB, aggregate sites like FlightRadar don't report the PD helicopter positions (I think plane owners can request that their tracks not be reported on these sites). The data is out there, you just have to know how to get it.
Someone on the Livermore version of NextDoor posted yesterday that there was a helicopter hovering in the south part of town and that they wanted to know if anyone knew what was up. As usual the brighter minds of Livermore had the usual "government helicopter" conspiracy theories so I decided to take a look at the ADSB data I'd collected to see if there were any helicopters in it. I'd never tried looking specifically for helicopters, so I just skimmed the ID list and checked out everything that didn't match a prefix for a known airline (eg, SWA for Southwest). That turned up N404AJ, a twin-rotor Chinook operated by Billings Flying Service that's been helping put out the fires south of Livermore.
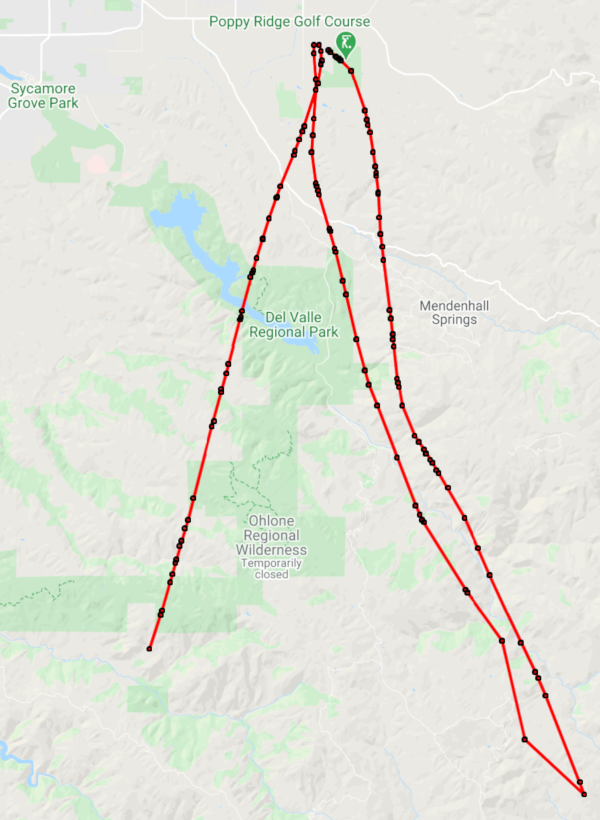
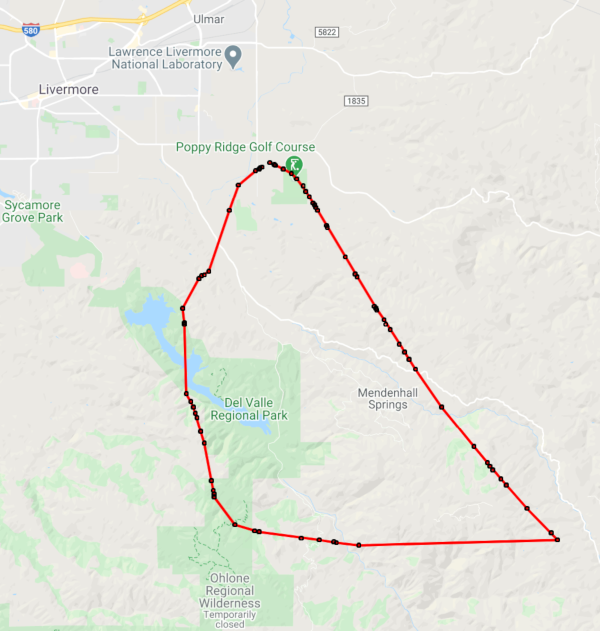
Tracks
It looks like the helicopter left the area yesterday to fight the new fire near Fresno, but these two tracks I captured show how they've been using Livermore as a staging ground to fight fires south of town. They've been landing near Poppy Ridge at Meadowlark Field, which also happens to have a giant Star Wars Rebel Alliance symbol in the field next to it.
Looking around the web some more, I found some photos of the helicopter and the video at the top of this post about how BFS contracted someone to build a tank module so they can dump fire suppressant on fires. So no, tin-foil-hatters of Livermore, not a secret Government operation- just fire fighters protecting your McMansions.
Recently, I needed to dig up some references to papers I either read or wrote back in the 1990s about programmable network interface cards. Out of curiosity, I did a search for my own dissertation on the web to see if it's floating around somewhere, 17 years after I published it. It didn't surprise me that some of the slide-scraping sites had copies of my defense presentation slides (I made these available on my Ga Tech website). However, I was surprised to find two sites that claimed to have an electronic copy of the actual dissertation since I had never made it available. As it turns out, the Georgia Tech library scanned in the paper version a few years after I graduated (cool!). The other place was some scraper site in China (maybe not so surprising).
The GT Library webpage said they didn't have permission to share the dissertation with people outside GT, so I contacted them and submitted the paperwork to make it world readable. The pdf download was disappointing though- it was 40MB in size (!) and had scanner burn on several of the pages. It occured to me that I could generate a better version, resurrected from my old files. That snowballed into a lot more work than I wanted, but I finally finished it and have added it to this website. Wading through it has given me an opportunity to reflect on what I wrote.
Converting to LaTeX
Resurrecting my dissertation was an absolute chore. At the time, my advisor was curious as to whether modern WYSIWYG editors were solid enough for a dissertation, so he suggested that we buck the time-honored trend of usng LaTeX and have me write it in MS Word 2000. It seemed like a valid, harmless decision when I started, but by the end of the writing it was a constant battle to get the document done before word corrupted it in some unfixable way. To this day, I still have a fear that I'll open a word document and all my section headers will have a mysterious "Char Char Char" phrase prepended to the section title. It was handy to be able to use Power Point and Excel to do my figures and plots, though. Plus, my advisor did periodically use the Track Changes feature to get me comments and corrections. It just would have been nicer to have something in between Word (hard to precisely control) and LaTeX (hard to view while writing).
For the conversion proces, I loaded each chapter into Libre Office and then exported to either text or LaTeX depending on how complicated the text was (the LaTeX output always seemed to spew a lot of extra junk that needed to be filtered out). GT had a standard thesis/dissertation template available that did most of the document boilerplate work for me. The hard part about this process was writing a bunch of one-off awk/grep scripts to correct all the formatting mistakes that happened during export. Importing all the figures was nother problem, but I found the modern version of word let me save my Power Points/plots to pdf, which I could then trim with Linux tools. Done. The last chore was proofreading the text and fixing the bibliography. 17 years is a long time for references to stay valid and many of the product white papers simply disappeared. In the end I think I produced a pretty decent spin of my dissertation that's only 1.6MB in size. I've added a post with the dissertation back on 11/19/2002 when it happened.
Better Material than Expected
I'll admit that when I started reading my dissertation I had low expectations about the content. While I put a lot of work into my research topic, I've always felt like it was a 5% research / 95% development effort. Everyone that starts grad school thinks they'll hit some keen idea that will come up with a new way to do things that will beat quicksort, get around the Nyquist sampling rate limits (compressed sensing kinda did!), or cure cancer. Over time, most people realize that the idea tree was picked clean by the 1960's, and that most of what we've been doing since then is reacting to improvements in technology. Still, there's a lot of snobbery among researchers that if you're not writing a lot of theorems, lemmas, and QEDs in your papers, you're not doing research. My dissertation had zero proofs so I've always felt like I messed up somewhere.
Reading the text again though, I realized I explored a lot of ideas that people hadn't dug into much at the time, and that some of those ideas were things that have only become important to others in the last decade. My thesis was about how you could design a message layer that ran on a programmable NIC and managed all the gritty details about communication so that both host CPUs and peripheral devices could access the network. My word did all the things other people did at the time (low-latency, high-bandwidth messages between hosts, RDMAs to physical and virtual memory, network-interface based multicast!), plus it let you steer data to multimedia cards (video capture/display, FPGA accelerators, and storage cards). In retrospect, this kind of thing became a lot more important 5 years later when people needed a way to route data between GPUs, or more recently when vendors returned to building Smart NICs so people could embed operations in the fabric. While my dissertation had zero impact on any of this, it at least feels good to look back on it and see that I was on the right track.
The Negatives
The main negatives I had about my dissertation was that it was simply too long and filled with details that nobody would care about. After five years of Ph.D. work, I had a chip on my shoulder and wanted to write about every single aspect of what I had done, no matter how boring it was. I understand now that conciseness is the key to good writing, and that giant chunks of text could have been moved to an appendix or dropped entirely. When profs commented about how much text there was, I remember telling them I wanted it there so I'd have it for myself to read later. Well, grad-school-Craig, mid-career-Craig wants you to know he appreciates the sentiment, but he doesn't want to read all of that either. As they say out here in future land, ain't nobody got time for that.
Remembering Sudha
Reading my dissertation reminded me of all the great conversations I had with my advisor, Sudha Yalamanchili, during those years (and in later work visits). Last year Sudha passed away after a long, quiet fight with cancer. GT was not exactly a friendly school, but Sudha always had an optimism to him that made me want to stay longer and try out new ideas. While I made grad school go on longer than it should have, I'm proud of the work I did with this dissertation and am glad that I had Sudha to guide me through the whole process.
Several years ago I bought a broken remote-control truck toy for a buck at a school fund raiser. I knew I wouldn't get the RF part working again, but the chassis had wheels and motors that looked like they were in good condition. I took the thing apart and verified all I had to do was power the wheels in the back to get them spinning, and apply pos/neg voltages on the wheels in front to get them to turn in either direction. I bought some L293D chips so I could flip directions on the motors and had plans to hook it up to an Intel Edison. The project fizzled out though because the Edison didn't have very good support and it was a pain to connect up your own parts to it.
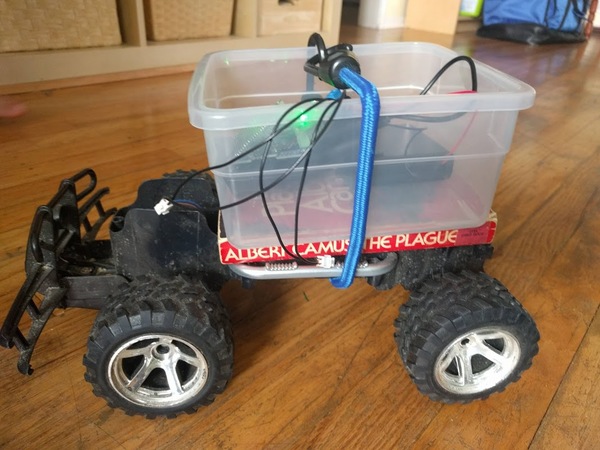
A few weeks ago I got interested in I/O with the Raspberry Pi and decided I should revisit the RC car project. Rather than breadboard it up, I decided I should just buy a Motor Hat board for the car and be done with it. This morning I finally got the whole thing together- I'm calling it Rolling Plague, since I wound up using a copy of Camus's The Plague to lift the controller off the wheels. Plus, everything is absurd.
Parts List
It took a while to pick out the right parts for this project. The main things were:
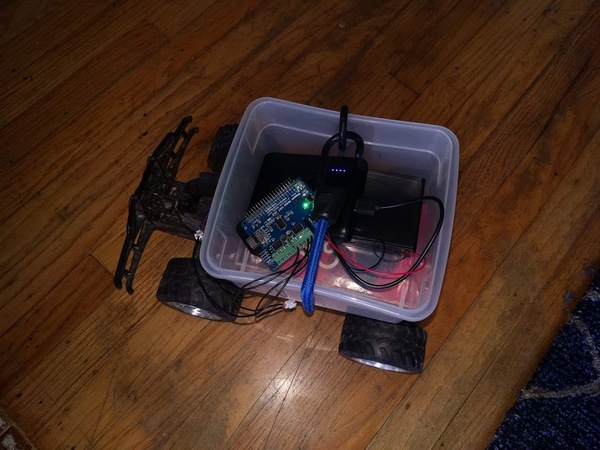
Raspberry Pi Zero W: Since this is an embedded project, I bought a Pi Zero W kit with the usual accessories. The Pi doesn't have to do much (handle a wireless connection and run I2C commands to the motors), so the smaller low-power board was appealing. I wanted the WH board, but didn't find it for cheap anywhere.
UGEEK Stepper Motor Hat v0.2: There are a few Motor Hat boards on Amazon (I assume most are clones of the one from Adafruit). While all I needed was something to control the DC motors, I thought it would be nice to have one that could also drive multiple servos (maybe I'll put a multi-axis camera mount on it later and see what's under my house). The UGEEK hat (see AliExpress) has a sourceforge repo with some drivers and docs (well written, too).
4xAA Battery Pack: The Motor Hat needs an external power source to drive the motors. I picked a simple 4xAA battery pack (w/ on/off switch) so I could get 5v. It works, but the front wheels seem to need more power.
1300mAh USB Battery: To power the Pi I'm using a USB power bank (we bought this a while back as a backup for phones). It can source enough power to run the Pi, but I know the Pi3 board often complains about being lower than the recommended amount. The Pi can run for hours off this battery.
Hooking things Up
The biggest pain in this project was soldering the pins onto the Pi Zero board. I've never been great at soldering and the pitch is small enough that I had to get a magnifying glass out to do the soldering given my old eyes. I continuously felt like I was ruining the board. However, the board booted when I applied power, and the power/ground pins at least seemed to work ok. For this project all I really needed was the I2C pins to work, so I didn't test out all the gpio pins. I'm pretty sure this will be the last time I ever solder headers on though. If the WH version had been available. I would have gone with that.
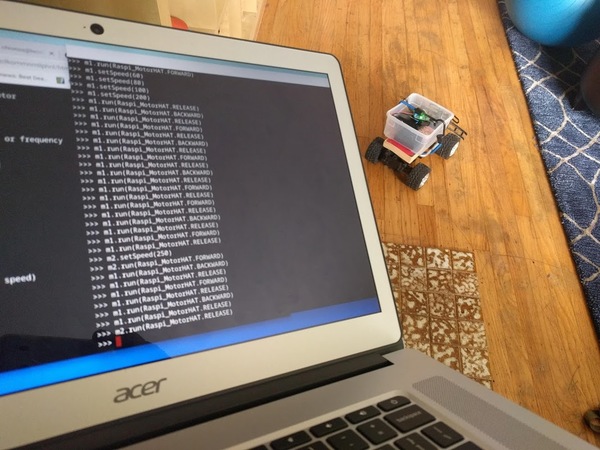
I booted the Pi up with the stock Raspbian Stretch Lite image and used a TV/keyboard to setup the OS. I used raspi-config to set the keyboard to US, connect to my wireless router, enable sshd, and enable I2C drivers. The motor hat's sample code needed smbus to run (I may have pip installed it, but you can apt-get python3-smbus). Once ssh was running, I detached the Pi from the TV and switched to using a chromebook to connect to it via ssh. The Zero was sluggish at times, but its python was good enough to issue io commands.
The wiring for the board was pretty easy to hook up. I plugged the 5V batter lines into the HAT and then ran the DC motor lines into M1 and M2 on the board. I also hooked up a servo and tested it out with the example programs. Their library did all of the work of setting up the controller over the I2C. All I needed to do was issue some python commands on the Pi to get it to turn left and right. I did the same things with the DC motors. Basically you set the speed of a DC motor (0-255) and then send a direction command to tell it which direction to spin (forward, reverse, or disengage). The chipset sends a PCM sequence that throttles how much voltage is seen by the motor (averaged over time). It was pretty thrilling to see the back motors spin up and go. They needed a value of 30 or so to get going.
Back and Forth
I didn't want the electronics to get smashed so I put them in a small plastic bin that I could strap to the chassis. The bin didn't quite clear the wheels, so I grabbed a paperback version of The Plague and stuck it between the chassis and the bin. The whole thing is strapped together with a shock cord.
I set the back motor to the minimum power setting and told it to go forward. It immediately went backwards (I hadn't bothered to figure out polarity) and ran into something. I flipped the wires around and issued a few commands to go forwards and backwards. The extra weight of the batteries (and Camus) meant I had to provide a higher value (around 40) to the monitors to get the car going. Similarly, the front wheels didn't turn very sharply, even when using the top value (255). I'll probably need to increase the battery voltage to get it to work a little better.
Driving the car was pretty clunky, largely because I had to issue multiple commands to get each motor to change state (ie, set speed and then enable/disable the motor). My kids started driving their RC cars around me and there was no hope of me keeping up. I'll need to come back later and write some functions to simplify the driving.
Naming
In retrospect, Camus's book seems like an appropriate choice for this project. It's pretty ridiculous to put all this effort (and money) into building an RC car that's nowhere near as usable as a $10 car from a toy store. Still, it's important to keep doing the things you do, no matter how absurd they are.