2015-03-08 Sun
tracks gis code planes
One of the problems of capturing your own ADS-B airplane data is that there are always bad values mixed in with the good. As I started looking through my data, I realized that every so often there'd be lon/lats that were nowhere near my location. Initially I thought I might be getting lucky with ionospheric reflections. However, a closer look into where these points are shows something else is probably going on here.
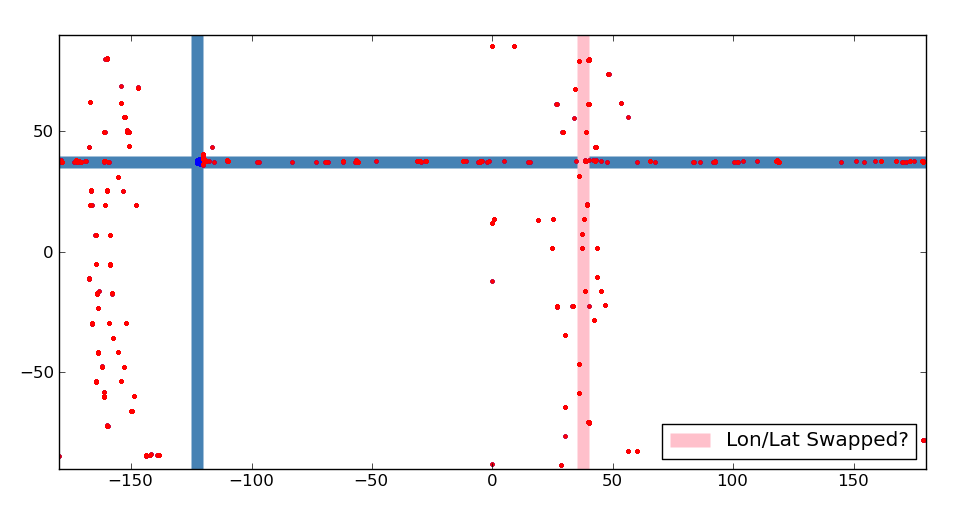
I wrote some Pylab to take all of my points and plot them on a world map (well, without the actual map). I marked of a rectangular to bound where Livermore is and then plotted each point I received. The points were colored blue if they were within the Livermore area and red if they were outside of it. I then extended the lon/lat boundaries for the Livermore area to help see where the far away points were relative to Livermore's lon/lat box.
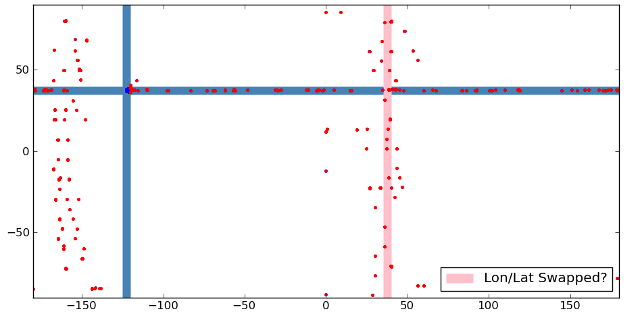
The first thing I noticed was that there were a whole slew of dots horizontally that fall within Livermore's lat range. It's possible that this could be due to bit errors in the lon field. The next thing I noticed was that there were two columns of bad points, one at about -160 degrees, the other around 35. Since both of these columns had data spread across all lats, I realized it probably wasn't from an ionospheric reflection. The right column happens to be at about the same value as you'd get if lon and lat were swapped (drawn as a pink bar). However, I don't think that's what happened, as the dots are distributed all the way across the vertical column.
Individual Offenders
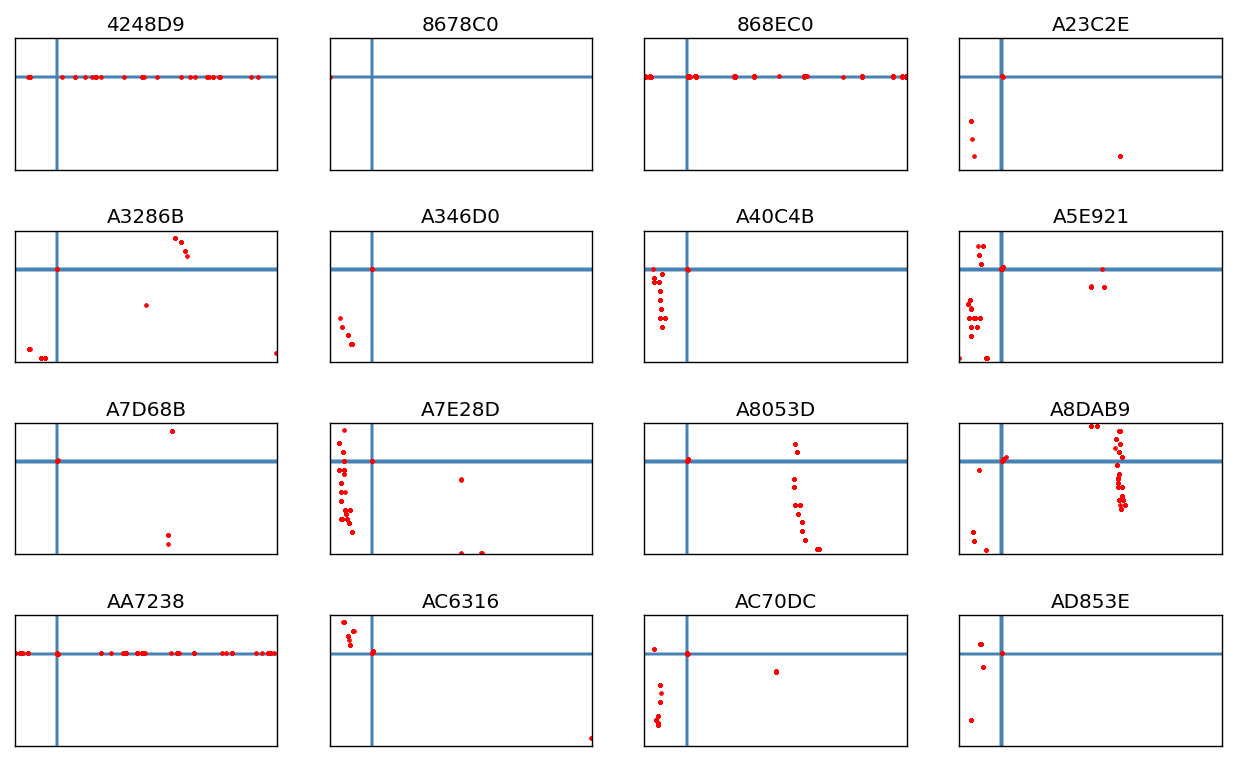
Since I didn't have a good explanation for the bad values, I did some more work on the dataset to pull out the individual offenders. Of the 2092 unique planes, only 16 were giving me problems. I plotted each plane's points individually below using the same plotter as before.
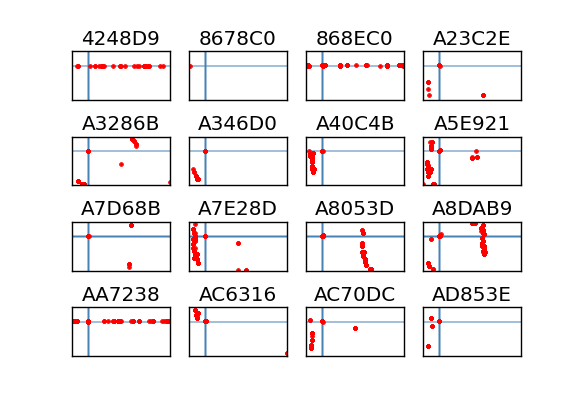
To me, these breakdowns indicate that the problem planes exhibit a few types of bad data. Three of them have purely horizontal data, while about 12 of the rest have some vertical problem. The 8678C0 case doesn't have enough points to tell what it's thinking. Interestingly, the vertical cases all seem to have at least a few points near Livermore. This makes me wonder if their GPS lost sync at some point in the flight and started reporting partially incorrect data. In any case there seem to be some common failure patterns.
Plane Info
Out of curiosity I went and looked up all 16 of these flights by hand to see what they were. It's interesting that all three of the planes with horizontal errors were't small planes (one old 747 and two new 777's). All the vertical errors seem to be from smaller planes (though one was a US Airways express). Here's the run down, including the number of days that I saw a particular plane in February:
#ID    Days Flight  Info
4248D9 1    VQ-BMS  Private 747 (1979) Las Vegas Sands Corp
8678C0 1    JA715A  Nippon Airways 777
868EC0 1    JA779A  Nippon Airways 777
A23C2E 4    N243LR  USAirways Express
A3286B 1    N302TB  Private Beechcraft 400xp
A346D0 1    N310    Private Gulfstream
A40C4B 2    N360    Private (San Francisco)
A5E921 7    N480FL  Private Beechcraft
A7D68B 1    N604EM  Private Bombadeer
A7E28D 1    N607PH  Private Post Foods Inc
A8053D 1    N616CC  Private Gulfstream
A8DAB9 1    N67PW   Private Falcon50
AA7238 7    N772UA  United Airlines 777
AC6316 1    N898AK  Private Red Line Air
AC70DC 2    N900TG  Private (Foster City)
AD853E 2    N970SJ  Private Gulfstream
Code and Data
I've put my data and code up on GitHub for anyone that wants to look at it.
github:livermore-arplane-tracks
2015-03-02 Mon
tracks gis
Now that I've been running the Edison airplane data logger for more than a month, it's time to start looking at the data it's been capturing. I pulled the logs off the sdcard, reorganized them into tracks, and then generated daily plots using Mapnik. The below image shows all of the flights the logger captured for each day in February.
The first thing to notice is that the SDR has a pretty good range, even with the stock antenna. I live just south east of the dot for Livermore and was only expecting to see planes near town. Instead I'm seeing traffic all over the Tri-Valley and some a little bit beyond. I was initially surprised to see anything in either the Bay area or the central valley because of the Pleasanton ridge and the Altamont hills. However, I realized it makes sense though- planes fly much higher than the hills, except when they're landing.
Logger Statistics
I wanted to know more about the data I was getting so I wrote a few scripts to extract some statistics. The first thing I wanted to know was what percentage of the time the logger was running each day. I made a decision not to run it all day when I started because there just aren't that many flights at night. In order to help me remember to start and stop the logger each day, I plugged the Edison into the same power strip my home router uses, which I usually turn on when I get up (7am) and turn off when I go to bed (11:30pm). I wrote a perl script to look through each day's log and find the largest gap of time where there was no data. Since the logger uses UTC, my nightly shutdowns usually appear as a 7 hour gap starting around 7am UTC. The top plot below shows what percentage of the day the logger was up and running. It looks like I was only late turning it on a few times in February.
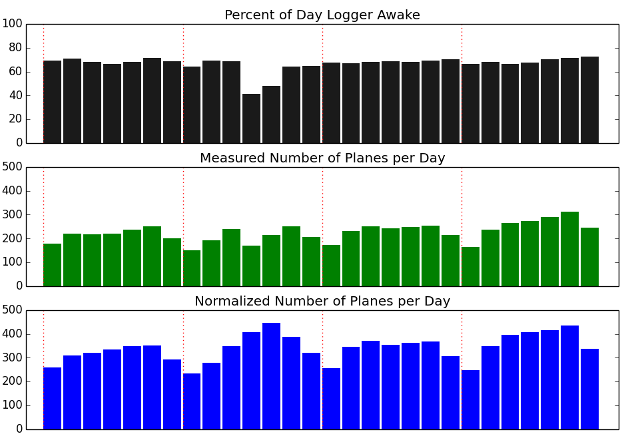
The next thing I wanted to know was how many flights I was seeing a day. The raw numbers are in green above, but I've also scaled them up using the top chart's data to help normalize it (no, not a fair comparison, as night flights are fewer). The red lines on the plots indicate where Sundays began on these plots. It looks like there's definitely lighter activity on Sundays. Things are a little skewed though, since everything is in UTC instead of Pacific (I was lazy and didn't bother to redistribute the days).
Missing IDs
The logger looks for two types of ADS-B messages from dump1090. The first is an occasional ID message that associates the hex ID for a plane with its call sign (often a tail fin). The second is the current location for a particular plane (which only contains the hex ID). Grepping through the data, I see 2195 unique hex IDs for the position messages, but only 2092 unique hex IDs for the ID messages. I checked and both message streams have some unique values that do not appear in the other message stream.
What Airlines am I Seeing?
Another stat I was interested in is what airlines show up the most in my data. It isn't too hard to get a crude estimate of the breakdown because (most?) commercial airlines embed their ICAO code in their flight number. Through the power of awk, grep, sed, and uniq, I was able to pull out the number of different flights each provider had over my area (this is unique flight numbers, not total flights). Here are the top 20:
404 UAL  United Airlines
114 VRD  Virgin America
 84 FDX  Federal Express
 72 AAL  American Airlines
 51 DAL  Delta Airlines
 46 JBU  Jet Blue
 45 SKW  Sky West
 38 AWE  US Airways
 29 EJA  Airborne Netjets Aviation ExecJet
 26 UPS  United Parcel Service
 22 RCH  Airborne Air Mobility Command "Reach"
 18 CPA  Cathway Pacific Aircraft
 17 OPT  Options
 16 EJM  Executive Jet Management "Jet Speed"
 11 TWY  Sunset Aviation, Twilight
 11 HAL  Hawaiian Airlines
 11 CSN  China Southern Airlines
 10 KAL  Korean Air
 10 EVA  EVA (Chinese)
  7 AAR  Asiana Airlines
There are a few things of interest in that breakdown. First, freight airlines like FedEx and UPS show up pretty high in the list. I think people often overlook them, but they occupy a sizable chunk of what's in the air. Second, I didn't see anything from Southwest in the data. They definitely fly over us, so I was surprised that I didn't see any SW or WN fins. Finally, there were a ton of planes that didn't have any info associated with them that would help me ID the owner (e.g., there were 456 N fins). There are websites you can go to to look them up (most of the time it just gives a private owner), but it's something that sinks a lot of time. Maybe later I'll revisit and write something to automate the retrieval.
2015-02-08 Sun
gis edison code
Lately I've been spending a good bit of my free time at home doing ad hoc analysis of airline data that I've scraped off of public websites. It's been an interesting hobby that's taught me a lot about geospatial data, the airline world, and how people go about analyzing tracks. However, working with scraped data can be frustrating: it's a pain to keep a scraper going and quite often the data you get doesn't contain everything you want. I've been thinking it'd be useful if I could find another source of airline data.
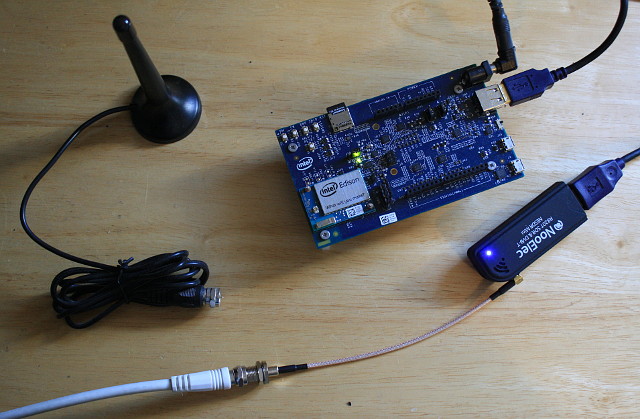
I started looking into how the flight tracking websites obtain their data and was surprised to learn that a lot of it comes from volunteers. These volunteers hook up a software-defined radio (SDR) to a computer, listen for airline position information broadcast over ADS-B, and then upload the data to aggregators like flightradar24. I've been looking for an excuse to tinker with SDR, so I went about setting up a low-cost data logger of my own that could grab airline location information with an SDR receiver and then store the observations for later analysis. Since I want to run the logger for long periods of time, I decided it'd be useful to setup a small, embedded board of some kind to do the work continuously in a low-power manner. This post summarizes how I went about making the data logger out of an Intel Edison board and an RTL-SDR dongle, using existing open-source software.
RTL-SDR and ADS-B
The first thing I needed to do for my data logger was find a cheap SDR that could plug into USB and work with Linux. Based on many people's recommendations, I bought an RTL-SDR USB dongle from Amazon that only cost $25 and came with a small antenna. The RTL-SDR dongle was originally built to decode European digital TV, but some clever developers realized that it could be adapted to serve as a flexible tuner for GNU Radio. If you look around on YouTube, you'll find plenty of how-to videos that explain how you can use an RTL-SDR and GNU Radio to decode a lot of different signals, including pager transmissions, weather satellite imagery, smart meter chirps, and even some parts of GSM. Of particular interest to me though was that others have already written high-quality ADS-B decoder programs that can be used to track airplanes.
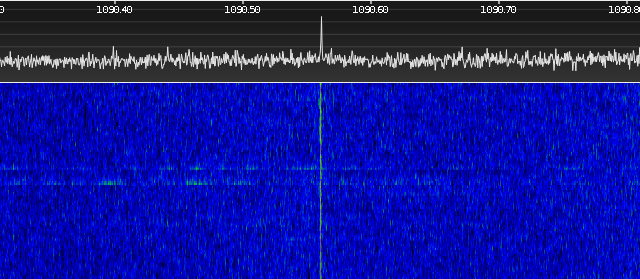
ADS-B (Automatic Dependent Surveillance Broadcast) is a relatively new standard that the airline industry is beginning to use to help prevent collisions. Airplanes with ADS-B transmitters periodically broadcast a plane's vital information in a digital form. This information varies depending on the transmitter. On a commercial flight you often get the flight number, the tail fin, longitude, latitude, altitude, current speed, and direction. On private flights you often only see the tail fin. The standard isn't mandatory until 2020, but most commercial airlines seem to be using it.
If you have an RTL-SDR dongle, it's easy to get started with ADS-B. Salvatore Sanfilippo (of Redis fame) has an open source program called dump1090 that is written in C and does all of the decode work for you. The easiest way to get started is to run in interactive mode, which dumps a nice, running text display of all the different planes the program has seen within a certain time range. The program also has a handy network option that lets you query the state of the application through a socket. This option makes it easy to interface other programs to the decoder without having to link in any other libraries.
Intel Edison
The other piece of hardware I bought for this project was an Intel Edison, which is Intel's answer to the Raspberry Pi. Intel packaged a 32b Atom CPU, WiFi, flash, and memory into a board that's about the size of two quarters. While Edison is not as popular as the Pi, it does run 32b x86 code. As a lazy person, x86 compatibility is appealing because it means that I can test things on my desktop and then just move the executables/libraries over to the Edison without having to cross compile anything.
The small size of the Edison boards can make them difficult to interface with, so Intel offers a few carrier dev kits that break out the signals on the board to more practical forms. I bought the Edison Arduino board ($90 with the Edison module at Fry's), which provides two USB ports (one of which can be either a micro connector or the old clunky connector), a microSD slot for removable storage, a pad for Arduino shields, and a DC input/voltage regulator for a DC plug. It seems like the perfect board for doing low-power data collection.
Running dump1090 on the Edison
The first step in getting dump1090 to work on the Edison was compiling it as a 32b application on my desktop. This task took more effort than just adding the -m32 flag to the command line, as my Fedora 21 desktop was missing 32b libraries. I found I had to install the 32b versions of libusbx, libusbx-devel, rtl-sdr, and rtl-sdr-devel. Even after doing that, pkgconfig didn't seem to like things. I eventually wound up hardwiring all the lib directory paths in the Makefile.
The next step was transferring the executable and missing libraries to the Edison board. After some trial and error I found the only things I needed were dump1090 and the librtlsdr.so.0 shared library. I transferred these over with scp. I had to point LD_LIBRARY_PATH to pick up on the shared library, but otherwise dump1090 seemed to work pretty well.
Simple Logging with Perl
The next thing to do was write a simple Perl script that issued a request over a socket to the dump1090 program and then wrote the information to a text file stored on the sdcard. You could probably do this in a bash script with nc, but Perl seemed a little cleaner. The one obstacle I had to overcome was installing the Perl socket package on the Edison. Fortunately, I was able to find the package in an unofficial repo that other Edison developers are using.
#!/usr/bin/perl

use IO::Socket;
my $dir = "/media/sdcard";
my $sock;
do {
  sleep 1;
  $sock = new IO::Socket::INET( PeerAddr => 'localhost',
  	                             PeerPort => '30003',
                                Proto    => 'tcp');
} while(!$sock);

$prvdate ="";
while(<$sock>){
  chomp;
  next if (!/^MSG,[13]/);
  @x = split /,/;
  ($id, $d1, $t1, $d2, $t2) = ($x[4], $x[6], $x[7], $x[8], $x[9]);
  ($flt, $alt, $lat, $lon) = ($x[10], $x[11], $x[14], $x[15]);

  my ($day,$month,$year,$min) = (localtime)[3,4,5,1];
  my $date = sprintf '%02d%02d%02d', $year-100,$month,$day;

  if($x[1]==1){
    $line = "1\t$id\t$flt\t$d1\t$t1";
  } else {
    $line = "3\t$id\t$lat\t$lon\t$alt\t$d1\t$t1\t$d2\t$t2";
  }
  if($date ne $prv_date){
    close $fh if($prv_date!="");
    open($fh, '>>',"$dir/$date.txt") or die "Bad file io";
    $fh->autoflush;
  }
  print $fh "$line\n";
  $prv_date=$date;
}
Starting as a Service
The last step of the project was writing some init scripts so that the dump1090 program and the data capture script would run automatically when the board is turned on. Whether you like it or not, the default OS on the Edison uses systemd to control how services are launched on the board. I wound up using someone else's script as a template for my services. The first thing to do was to create the following cdu_dump1090.service script in /lib/systemd/system to get the system to start the dump1090 app. Note that systemd wants to be the one that sets your environment vars.
[Unit]
Description=dump1090 rtl service
After=network.target

[Service]
Environment=LD_LIBRARY_PATH=/home/root/rtl
ExecStart=/home/root/rtl/dump1090 --net --quiet
Environment=NODE_ENV=production

[Install]
WantedBy=multi-user.target
Next, I used the following cdu_store1090.service script to launch my Perl script. Even with a slight delay at start I was finding that the logger was sometimes starting up before the socket was ready and erroring out. Rather than mess with timing, I added the sleep/retry loop to the perl code.
[Unit]
Description=Store 1090 data to sdcard
After=cdu_dump1090.service
After=media-sdcard.mount

[Service]
ExecStartPre=sleep 2
ExecStart=/home/root/rtl/storeit.pl
Environment=NODE_ENV=production

[Install]
WantedBy=multi-user.target
In order to get systemd to use the changes at boot, I had to do the following:
systemctl daemon-reload
systemctl enable cdu_dump1090.service
systemctl enable cdu_store1090.service
It Works!
The end result of the project is that the system works- the Edison now boots up and automatically starts logging flight info to its microSD card. Having an embedded solution is handy for me, because I can plug it into an outlet somewhere and have it run automatically without worrying about how much power its using.
2015-02-20 Fri
gis planes bestof data
Not to sound crazy, but the Russians are watching me! Don't panic though- it's all been approved under an international treaty.
When I posted earlier about how I'd been collecting and analyzing airline data for fun, a friend of mine asked if military planes show up in the data. The answer turned out to be "not much", but while I was looking into it I started reading up on different ways governments fly military missions around the world for political reasons. For example, there were several stories in the news last year about how Russia has been sending long-range bombers into other countries' airspaces, presumably to test their air defenses or provoke a reaction. It would be interesting to look for these incursions in my data, but unfortunately they don't show up because the bombers are operating covertly, with their location beacons turned off.
Another story in the news last year involving military avionics was that the US and Russia had several heated exchanges over overt, surveillance missions that were to take place under the Open Skies treaty. The planes used in these missions do appear in public flight datasets. After reading through several websites, I found the tail fins for a few of these planes and learned that Russia just flew a mission over the US back in December. Not only did the plane show up in my data, it also flew over the city I live in!
Treaty on Open Skies
The Treaty on Open Skies allows the countries that have signed the treaty to fly unarmed surveillance flights over each other to promote better trust between governments. The treaty's origins can be traced back to Eisenhower, who proposed the Soviet Union and the US implement a mutual surveillance program for better military transparency. While the proposal was rejected, the idea resurfaced at the end of the cold war with support from many countries. The Treaty on Open Skies was signed by thirty-four state parties and went into effect in 2002. The treaty defines what kind of surveillance equipment can be used in the aerial missions, and specifies that the raw data captured during surveillance must be shared with all the other treaty members, if requested. Open Skies provides member countries with a better understanding of each other's capabilities, and makes it possible for all countries to participate, even if they do not have a sizable military budget.
Unfortunately, Open Skies also gets dragged into a number of political battles, as it permits a foreign country to come into your country and openly spy on you. Last year Russia threatened to block the US from flying a troop monitoring Open Skies mission over Ukraine. The surveillance missions were later allowed, but not before several congressmen in the US threatened to block Russian flights. While it's important to take steps to make sure the program remains mutually beneficial, it is clear that some politicians manipulate the facts about Open Skies to make it sound like its doing more harm than good.
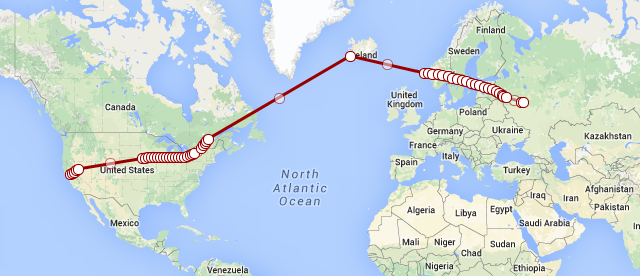
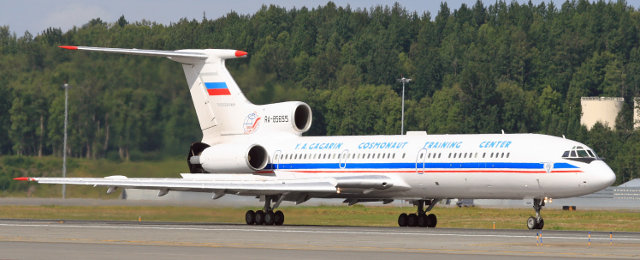
A Russian Surveillance Plane Flies to the US (December 8th)
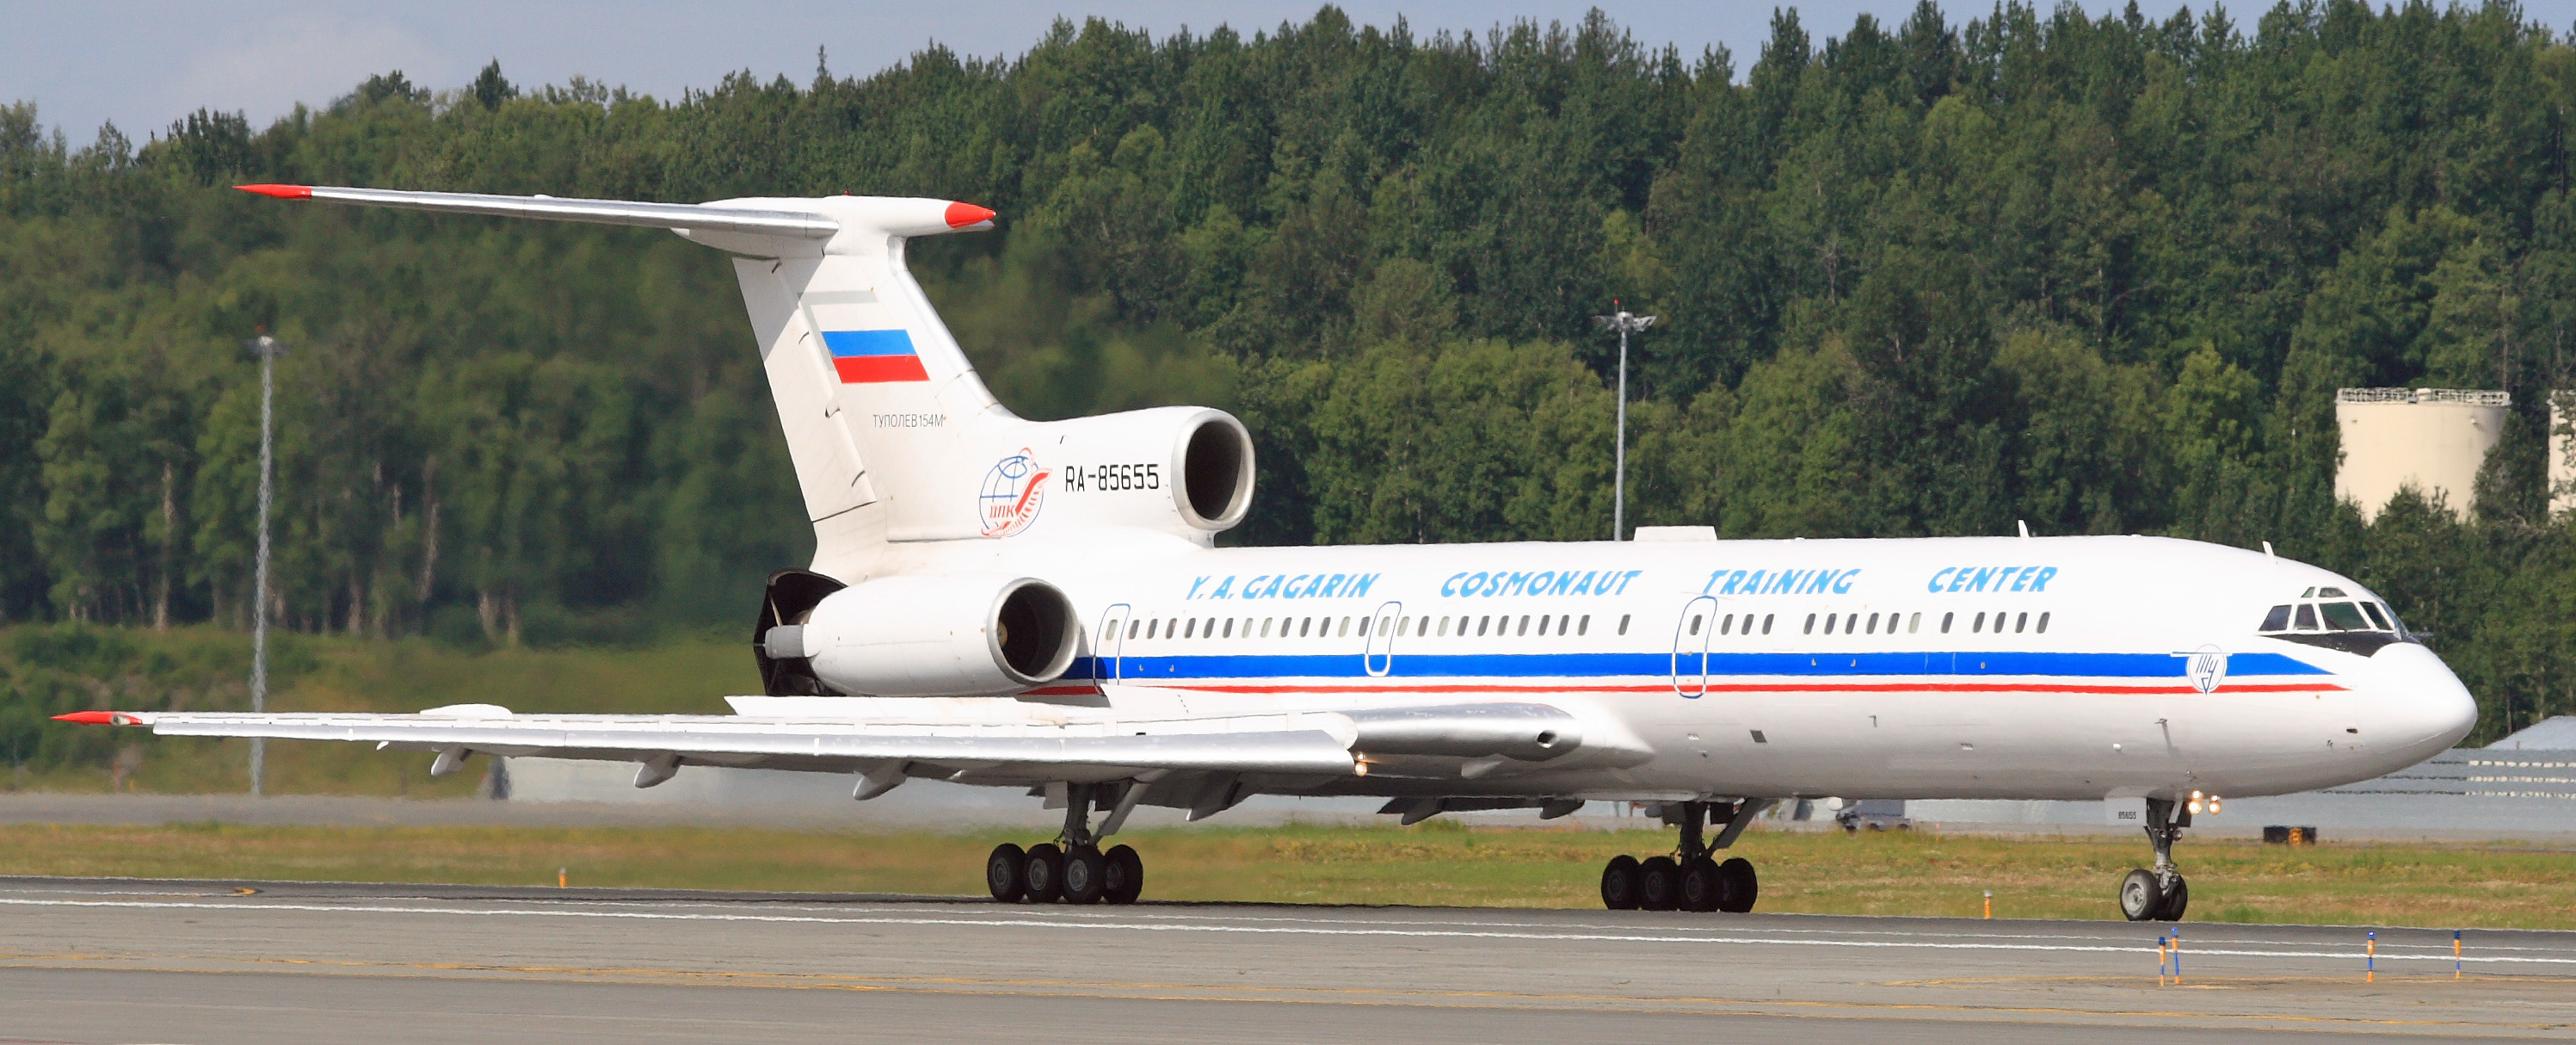
Looking through older news articles I learned that Russia had previously flown a modified Tu-154M-LK-1 plane with the ID RA-85655 during their Open Skies missions over the US. Wikimedia Commons has several user-submitted pictures of this plane, including the below from Frank Kovalchek (Creative Commons 2.0). The plane has "Y.A. Gagarin Cosmonaut Training Center" written on the sides (left in Russian, right in English).
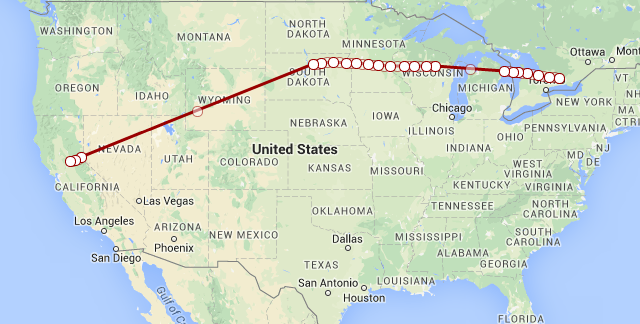
News stories reported that the plane was headed for Travis AFB, just north-east of the San Francisco Bay Area. A quick grep through the data I've been grabbing from FlightRadar24 revealed that RA-85655 traveled from Russia to the US on December 8th. Here's what the trip over the US looked like:
Surveillance of Southern California (December 10th)
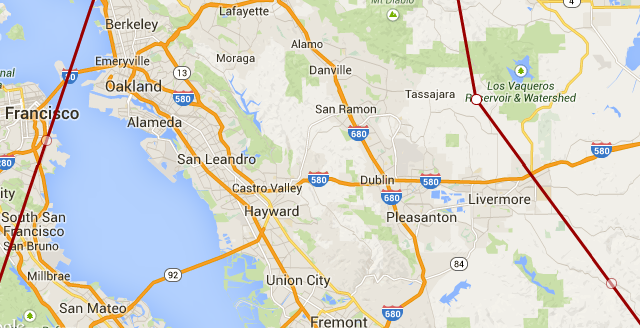
The best track I got for the plane was on December 10th as it made a loop through California. They covered a lot of ground in this sweep, visiting Travis AFB, San Francisco, San Jose, Vandenberg AFB, Longbeach, San Diego, and LA. It makes sense- Southern California is peppered with the defense industry and military bases. It's a little odd to me they flew to Half Moon Bay in Northern California. I would have thought they would cover more of the inner bay.
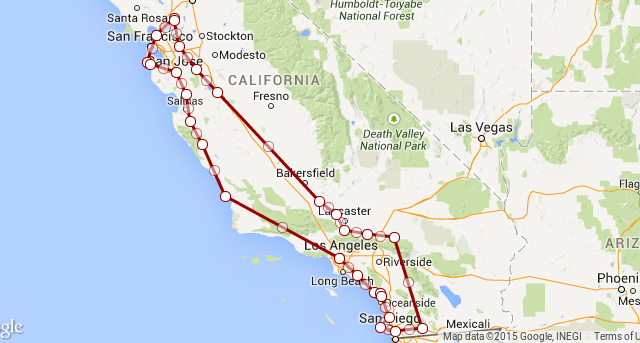
The part of this loop that's really interesting to me is that when they were close to finishing, they made a pass over Livermore (where I live). While we might have just been on the path back to Travis, it's quite possible that they wanted to take a look at NIF at LLNL. NIF is in the news because there's talk of them firing their lasers on plutonium in 2015. Maybe Russia wanted to get some "before" pictures, in case something goes horribly wrong. LLNL is the light brown block next to the 'e' in Livermore in the picture below. I believe it has a no-fly zone around it.
A Trip to Nevada (December 12th)
I didn't get any tracks for December 11th, but I did get a few points for the 12th. It looks like the plane made a trip out to Las Vegas. That grey area north west of Vegas is a big area of interest: it includes the Nevada Test Site, the Tonopah Test Range, and Area 51.
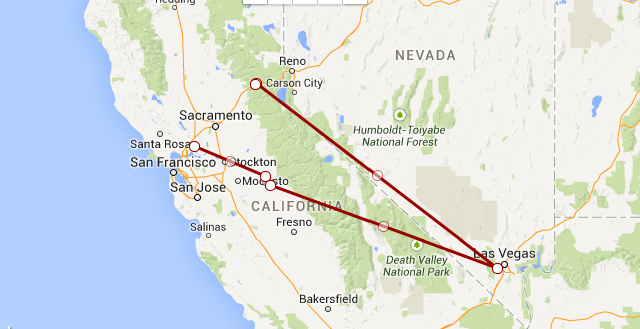
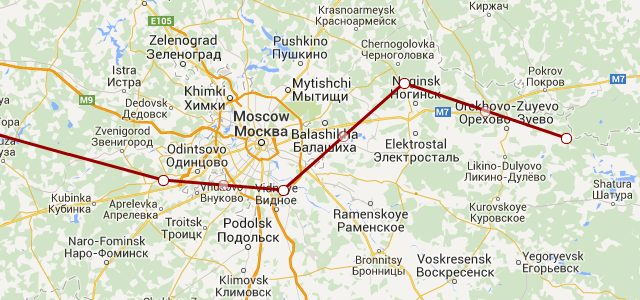
Returning to Russia (December 13th)
RA-85655 made the long journey back starting on December 13th (shown at the top of this post). I didn't get a landing point for the flight, but it did fly just south of Moscow before I lost it.
Data
Here is the data I used in this post, along with some simple instructions on how you can plot it yourself in a browser. For the record, this was all work I did in my spare time using data I collected from public sources (FlightRadar24).
2015-02-14 Sat
gis planes
Mind the gaps. Whenever I use a public website that provides airline information, I'm impressed with how much they know about flights that are in progress all around the world. However, there have been a number of times when I've started drilling down into the data only to find that the samples I want aren't there. Given that (I believe) a lot of the data actually comes from volunteers that monitor their own local regions with something like dump1090, it should be expected that there are gaps in coverage. That got me thinking: could I look at a day's worth of airline track data and estimate where there isn't coverage?
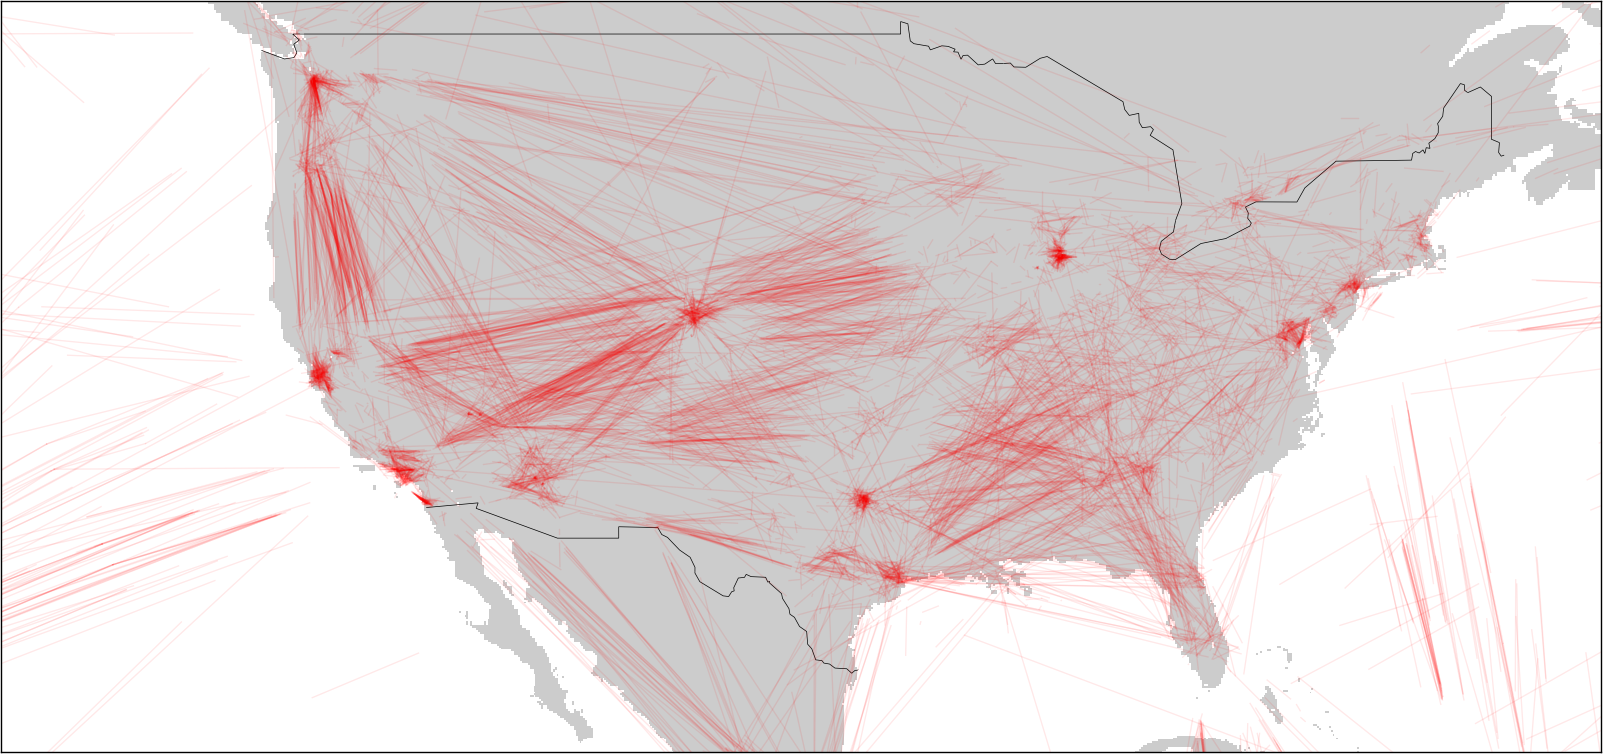
Earlier this week (while flying to Albuquerque!) I wrote a script to search for gaps in a collection of airline tracks. All this script does is walk through a track and inspect the amount of time between two sample data points. If the time for the segment is greater than a certain threshold, I estimate that the plane wasn't in a place where anyone could hear it and then plot the segment in red. Click on the pictures to get a closer view.
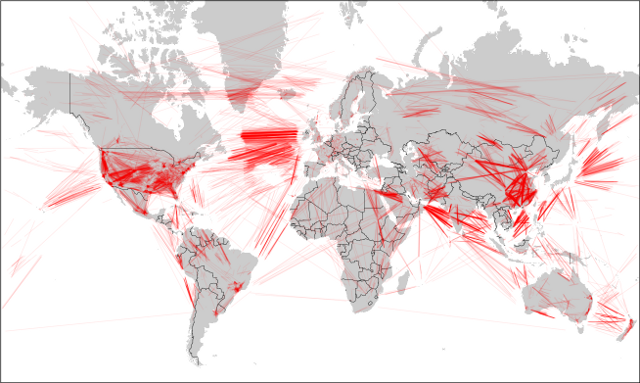
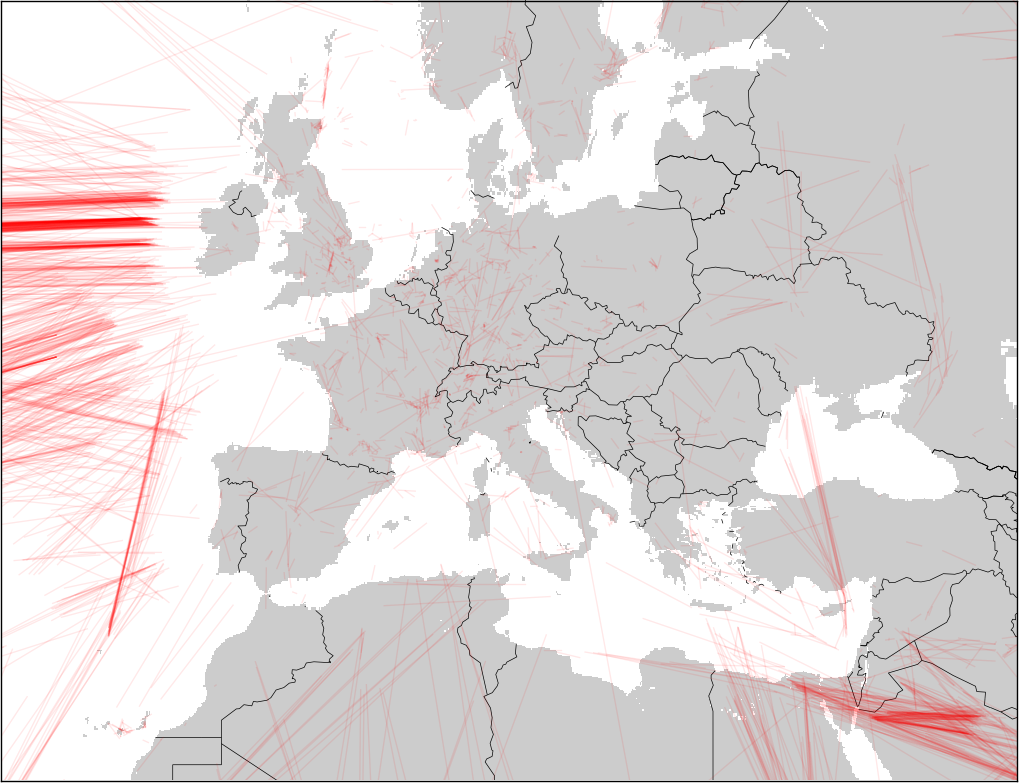
Again, missing data segments are in red (segments with data are not plotted, since they overwhelm the plots). As expected, a lot of gaps appear over the oceans, where nobody is listening. As FlightRadar24 has pointed out, coverage in different countries depends on the country's ADS-B policies and ground stations.
USA
I was a little surprised to see that the US has some dead space in the middle and south east. That might not be surprising as the FAA doesn't make the data available for free (afaik), and there are large unpopulated areas in the country.

Europe
Europe seems to be well covered. I'm not sure if that's because people do a lot more tracking there, or if governments do the right thing and make the data available.

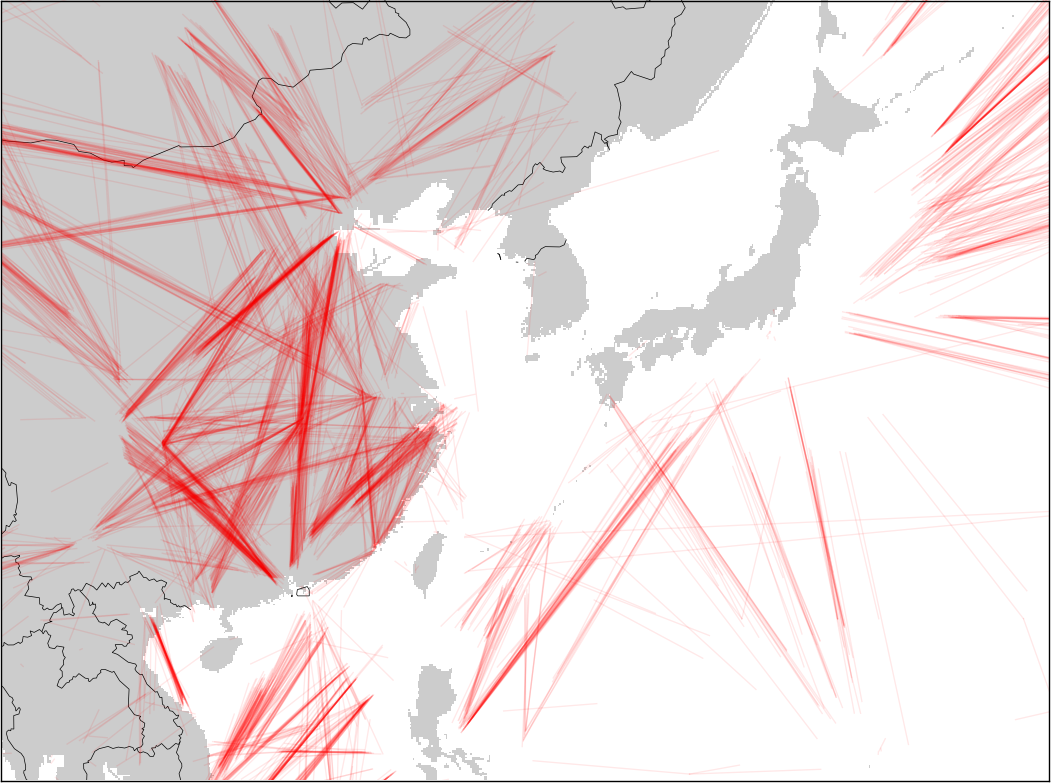
Western Pacific Rim
The Western Pacific Rim is interesting. Japan looks like it has excellent coverage. China must have coverage in the cities or on the coast, as there are a lot of flights with missing data on the interrior.
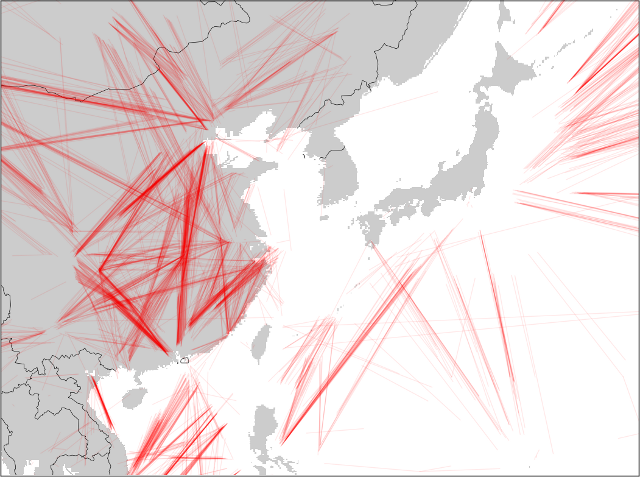
I'd been hoping there'd be something more interesting to look at around Korea. I've read that North Korea jams GPS from time to time and was hoping that I'd see a lot of gaps there. There weren't any stories of jamming for 2014 (afaik). Plus, I don't think there are many planes flying over NK to begin with.
Code
The gap_plotter.py plotter I threw together for this and a tiny sample dataset can be found here:
github:airline-plotters
This code just overlays line plots, so it's slow and breaks if you throw more than a day's worth of data at it. Some day I'd like to go back and build a propper analysis tool that grids and counts things.