For fun, I went through some of the images I captured from my webcam scraper project and converted them into timelapse videos. The videos are all pretty repetitive. However, the videos did help me spot some nice one-offs, such as the Vancouver lightning strike I reported on previously. Here are some Youtube clips of the more interesting ones.
Rising Tides
The tides can be interested to watch in timelapses. Check out the rise and fall of boats in these webcams from Alaska and Hilton Head:
France
I spent a summer in Metz, France during college, so it was nice to see pictures of the city and Paris come up in the screensaver. One of the Metz webcams tracked an interesting building with curvy architecture being built. The Eiffel Tower cam is fairly constant, but if you stop it around Bastille day you can see some fireworks.
Around Europe
There were a few other places I grabbed from around Europe. The problem I had with getting data from there was that with the timezone differences, it was often night there when my desktop was running, resulting in night images. Here are timelapses from Warsaw, the Vatican, and Switzerland.
California Mountains
California also has some good cameras out in the mountains. Here are two from Mount Wilson (at the Mt. Wilson Observatory near L.A.) and Mount Shasta.
The Bay Area
The bay area has a few good cameras, besides the normal traffic cams. Here are cameras from downtown, Sausalito, and Berkeley.
Atlanta
I only found a few webcams for Atlanta, but the skyline camera always looked good to me. Georgia State used to have a really good, user-controlled camera with a strong zoom that let you look around the downtown streets and buildings. It was interesting to watch how other people controlled the camera. I often thought that if I watched it long enough I'd witness some downtown crime.
Antarctica
I was surprised to find that there are multiple webcams in Antarctica, and that they are well maintained. I don't seem to have it anymore, but on mother's day, someone left a sign in front of the webcam that said "I love you mom". The below timelapse is a little boring, but midway through it you see sea lions and penguins (I think) come up on shore.
Vancouver
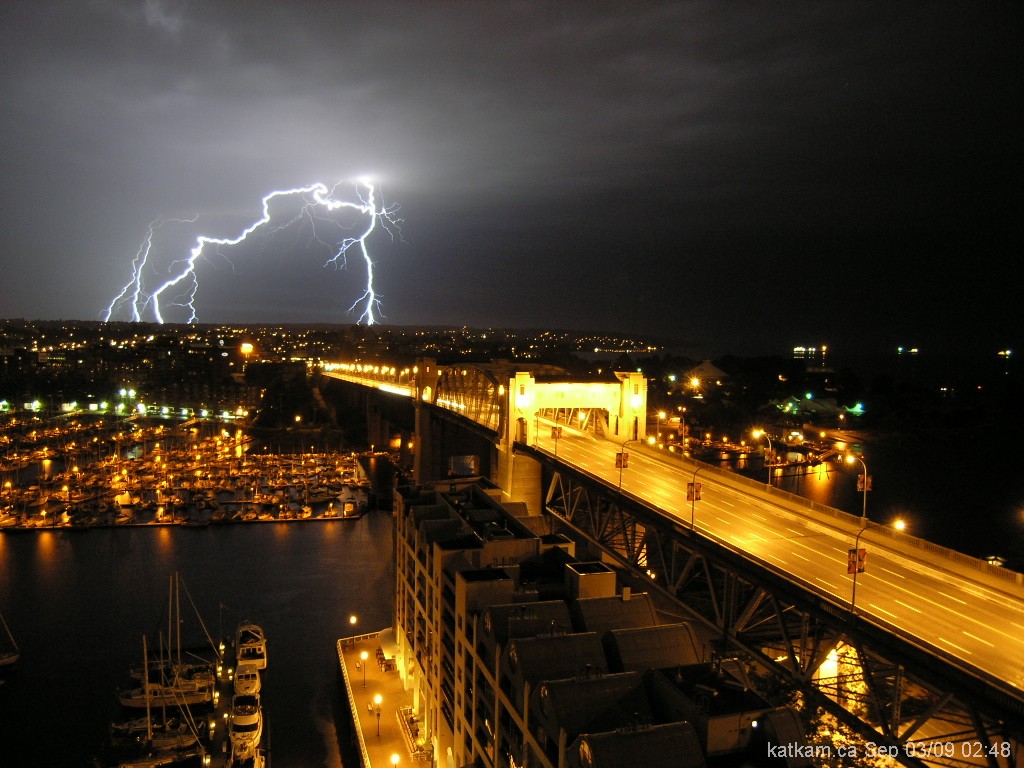
Finally, here's my favorite camera, the one pointed at the Burrard Bridge in Vancouver. If you look around 34 seconds into it, you'll see the lightning strike I mentioned in the previous post.
I had a chance to looked through my webcam dataset a little more and pick out a few interesting moments. First, my favorite site was a long-running webcam in Vancouver called KatKam, which shows the Burrard Bridge and the English Bay. I've never been there before, but the colors of the water, sky, and bridge often looked pleasant. While flipping through its pictures, I noticed that one night the webcam caught a lightning strike in the distance:
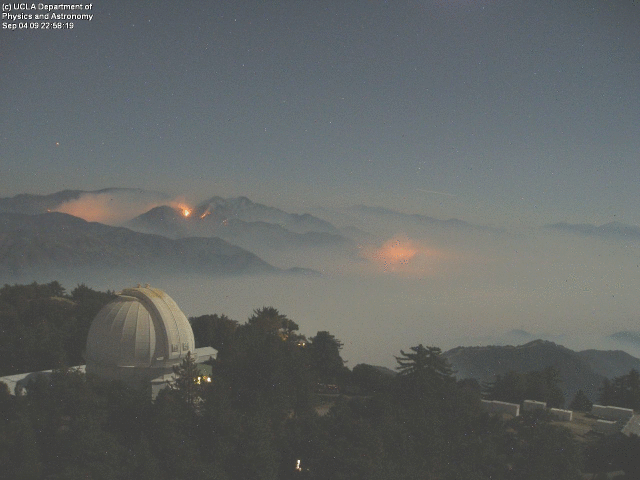
Another favorite webcam for me is at the Mount Wilson Observatory, near LA. I visited the observatory one time when I lived in Pasadena and thought the massive 100-inch Hooker Telescope was really amazing. Their webcam captures a few different views of the surrounding area, including the mountains, the observatories, and LA. However, back in September of 2009 it monitored a major forest fire as it marched over the hills. It must have been terrifying to watch it move from crest to crest, getting closer every day:
The Eiffel Tower was also another good one. There were at least three different cameras pointed at it, so if a supervillain ever did make a ray gun to steal it, it would be well documented. The Eiffel Tower was also one of the few places in Europe that I continued grabbing after dark, as they often had interesting light displays on it and around it during the holidays. Bastille day was a good day to check it out- I even caught some fireworks around it in 2009:
While cleaning up an old network-attached storage (NAS) box at home the other day, I found the remnants of an old, webcam-scraping project I built when we first moved out to California. California was an interesting place for us, but we often felt like we were out of sync with the world because all of our friends and family lived back on the East coast. One day while looking through the screensaver options on my desktop I started thinking about pictures I could plug into it to remind me of home. I then had an interesting idea: why not write a simple script to periodically download pictures from public webcams, and then route them into the screensaver? These webcams could provide a simple, passive portal by which we could keeps tabs on the places we used to know.
It didn't take long to write a simple Perl script that scraped a few webcams and save the images to my screensaver's picture directory. As I started adding more webcams I found I needed to do more sophisticated things with the script. After the project stabilized I migrated it over to a low-power NAS, which allowed the scraper to run at more reliable intervals. Eventually I retired the project, because the never-ending updates from around the world were just too distracting.
Building the Webcam Scraper
The first version of my webcam scraper used a simple Perl script to retrieve images from different webcams I'd found on the web. This work wasn't difficult- many of the webcams I looked at simply referenced their most recent picture with a static URL. All I had to do was store a list of URLs I wanted in a text file and then use the Perl script to download each URL and datestamp its image. It didn't take long before I found a few webcams that used URLs that changed over time. I updated my script so it would parse the html page the images lived in and retrieve the image. In most cases this could be done by simply extracting the n-th image url in the page. The system worked well and I built up a good list of webcams I could use.
The next trick was adjusting how frequently the scraper grabbed data. Webcams update at different intervals and are often offline (or boring) at night in the webcam's timezone. I added some timing interval info to my webcam list to control how frequently to grab (hourly, daily, weekly), as well as some hooks to set the hours of operation for the grabs. I also compared a grab to its previous result in order to do simple deduping. If a webcam returned too many duplicates in a row, or no data at all, the script marked it as inactive so I wouldn't pound their server over and over.
By this point the list of webcams was getting long and becoming difficult to manage from the command line. I rewrote the script to externalize all of the URL data and statistics into a SQLite database. This database enabled me to keep better statistics on each webcam, which in turn let me make more rational estimates about whether a camera was out of commission or not. The database also gave me an easy way to throw a simple GUI on top of it. All I had to do was write a Perl CGI script to take user input and feed it into the database. Editing the settings in a web page was a huge improvement over text files.
Running on a NAS
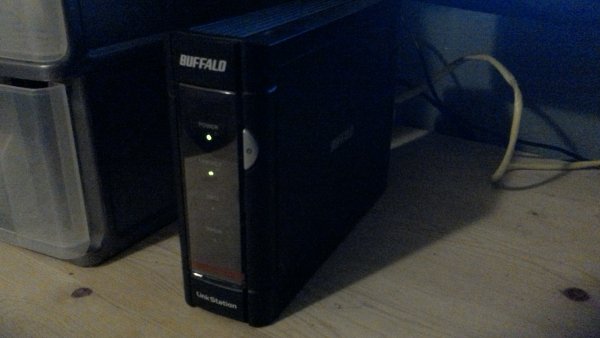
I originally ran the scraper on my desktop, but it didn't have very consistent results because I only powered up the desktop when I needed it. I happened to have a Buffalo Linkstation NAS, which I'd read ran Linux on an ARM processor. After reading a lot of webpages, I found that others had found a security vulnerability in the Linkstation's software, and had written a tool that let you exploit it to get a root account (!!). I ran the script, got root, and installed some missing binaries to make the box more usable. I had to cross compile some tools from source since the Linkstation uses an ARM, but the open NAS community did a good job of spelling out everything you needed to do.
I didn't have to do much to get the project running on the NAS. I had to install some Perl packages and SQLite libraries, but the scraper worked without any major changes. I created a cron job to run the scraper once an hour and had it dump data to a directory that was exported. The Linkstation already had a web server on it, so all I had to do to install my web-based editor was copy the CGI script into the existing webserver directory. The nice thing about running on the NAS was that the hardware only ran at about 7W, so I didn't feel bad about leaving it on for long periods of time. Before there was the cloud for launch-and-forget apps, I had the NAS box.
Routing to a Screen Saver
Getting pictures into a Linux screensaver was more annoying than I thought it would be. GNOME's default screensaver was very particular about where you were supposed to put pictures. It wasn't a big deal when I ran the scraper on my desktop, but when I started using the NAS, I didn't have a way to point GNOME at the NAS's mount point. The solution was to ditch GNOME's screensaver and start using XScreenSaver. GNOME didn't make it easy to switch, but XScreenSaver gave me all the options I needed for controlling where it should get pictures. The scraper stored each webcam's pictures in its own directory, and then merged the latest results into a separate directory that XScreenSaver could use.
Statistics
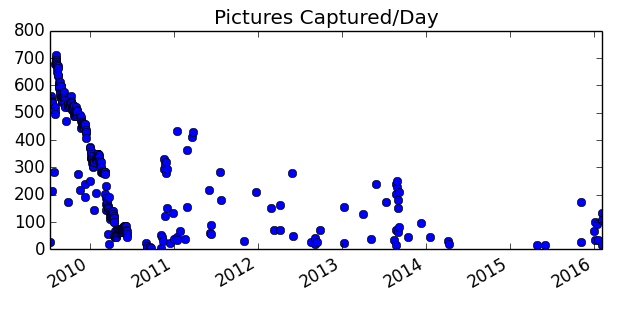
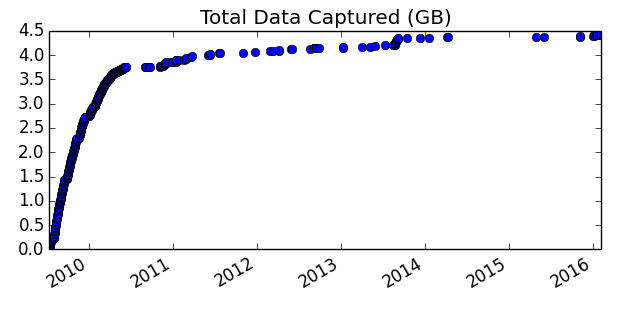
The plot below shows how many pictures I was grabbing a day. This data is interesting to me because it shows two things. First, the dots get more sparse as time goes on because I changed how often I powered up the NAS. Initially I had it running all the time, but then I started running it only when I needed it. Eventually I stopped using it altogether, except when I wanted to do backups. The second point from these plots is that you can see how webcams die off over time. I didn't update the webcam list very often (maybe once a year at best). Webcams are often short lived, unfortunately, Thus, the number of images dropped off over time as different cams died.
In terms of data, I grabbed from 60 different webcams and accumulated 107K pictures. The pictures amount ot about 4.5GB of data, which means the average picture was about 42KB. The majority of the data came in the first year of use.
Ending
The webcam project was fun but addictive. Any time the screensaver kicked on I found myself watching it like TV, wondering what the next webcam would look like. I worked on a few other features before I moved on. One was the ability to grab short video streams from MJPEG webcams. It wasn't hard to grab these video streams, but I didn't have a way to display them in the screensaver.
I also learned a good bit about security and privacy during this project. While searching for new sources, I found that a lot of people were installing webcams without realizing they were accessible from anywhere in the world. You can find tons of open IP webcams on Google through "inurl" searches. Most of these were traffic cams or convenience stores, but I also saw some home cameras that were in the open (e.g., pet cams for people to check up their pets during the day). This hits on a big problem with consumer security these days- how do you know your devices aren't doing something you'd be upset to hear about? Better home gateways would be a start. ISP analysis would be even better, assuming people didn't freak out about a third party is monitoring their connections.
The other day while writing some RPC code for a network library I started wondering if I could use c++11 features to manage my function handlers. Specifically, I was wondering if I could do some compile-time hashing to uniquely identify each RPC by integer value. Stack Overflow had a great post about how to do it, but my initial tests found the hashes didn't always happen at compile time the way I had naively hoped they would. Using nm and objdump I figured out how to make my specific use case work.
The Problem with RPC Names
One of the nitpicky things that bugs me when I write remote procedure calls (RPCs) for a C++ network library of ours is deciding on a way to uniquely label each RPC with an integer value. Some network libraries I've used just punt and tell you to pound define each identifier, which sooner or later results in a collision when you merge code from different people. Other libraries use string labels and figure out how to translate strings to integers at run time (possibly as part of connection handshaking). These are a pain as well, as there's extra work that has to happen at init time.
What I'd really like is to use string labels for RPCs, but have the labels all hash to integer values at compile time. I'd like the hash value to be a constant associated with an RPC class that doesn't need to be set every time you create a new instance of the RPC. The hash can be weak, because I can detect collisions at init time when each RPC is registered and tell users to come up with a different name (or hash).
Prior to C++11 (or maybe C++0x), I don't think it was possible to have the compiler hash a string at compile time. You could plug in macros to hash the name, but as far as I know, you'd get code that at best executed the hash at run time every time you wanted the hash.
Compile-time Hash on Stack Overflow
I'm not the only one that wanted to do compile-time hashes. This stack overflow question asked exactly what I'd been wondering- can C++11 be used to hash a string at compile time. Their answer was yes- under certain circumstances, you can craft a constexpr that did the work. Specifically, one of the examples implemented a simple hash by recursively stepping through an array:
People seemed to agree that this should work, but I wanted proof that the hashing code was being done at compile time (especially since the hash now uses a recursive function). I wrote some simple tests and used objdump to look at the assembly g++ 4.8.2 was generating.
First Failed Test
My first test just looked at what happened if you just plugged a string into the hash and printed it. For example:
int main(){
  unsigned x = const_hash("bozo");
  cout << hex << x << endl;
}
The code prints out the hash 7c9c033f, so the hash is being done. However, nm shows that the hash function is still in there:
Declaring the string as a const or constexpr didn't help.
Progress with a Switch Example
Since it didn't look like I could just naively use the hash function to get what I wanted, I started looking at the original use case the s/o poster was after. The poster asked about compile-time hashes because they wanted to use them for cases in a switch statement. It's a useful thing to do when you write state machines- often you'd like to give each state a printable label, but at the same time, you'd like to boil the labels down to hash values at compile time to speed things up. I updated my example to call to use the hashes in a switch:
int testit(string s){
  switch(const_hash(s.c_str())){
  case const_hash("bozo1"): return 1;
  case const_hash("bozo2"): return 2;
  default:
    cout <<"Unknown" << endl;
  }
}
int main(){
  cout << hex << const_hash("bozo1") << endl;
  cout << hex << const_hash("bozo2") << endl;
  return testit("bozo1");
}
When running the program you see the bozo1 and bozo2 hashes are b886f27 and b889adf. Looking at the assembly for the testit function you see it calls the hash function on the input parameter (because the input could be anything), but each case operation's comparison has been hardwired to use the actual hash values that were generated at compile time:
The final step for me was just to plug this trick into something that resembled the RPC code I wanted. In this code, I have a base class to define a generic RPC, and derived classes for each RPC. All I want is to have each one to be able to provide a static integer identifier back when asked, and not have anything hash at runtime.
class A {
public:
  virtual unsigned GetID() const = 0;
};

class B : public A {
public:
  unsigned GetID() const { return my_hash_id; }
  const static unsigned my_hash_id;
};
const unsigned B::my_hash_id = const_hash("MyThing");

int main(){
  A *b=new B();
  cout << hex << b->GetID()    << endl;
  cout << hex << B::my_hash_id << endl;
}
Grepping through nm's output, I saw that const_hash wasn't included in the executable. Looking at the assembly I see GetID is a function that returns the hash value and B::my_hash_id is hardwired to the hash value. This behavior is sufficient for what I need. I'll use the static my_hash_id when I want to register a new RPC during initialization (which will also check for hash collisions), and then use GetID() if I need to figure out what RPC I really am if I was only handed a base class pointer. It really is overkill for what I need, but it's nice to be able to reference the RPCs without having to generate unique integer IDs myself.
A year ago I setup a long-running data scraper that would fetch flight info from the website FlightRadar24.com. I created a free Amazon VM that ran the scraper every six minutes for about eight months last year. In terms of raw data, it pulled about 200MB of data a day and collected a total of 56GB over the eight months. Now that I've retired the scraper, I thought I'd comment on how it worked.
In Search of Data
As I've written before, I started getting interested in geospatial tracks last year when I read about how different websites let you see where planes and ships are located in real time. Thinking that it'd be fun to get into geospatial data analysis, I started looking around for open datasets I could use for my own experiments. I quickly realized that there aren't that many datasets available, and that data owners like the FAA only provide their feeds to companies that have a legitimate business need for the data (and are willing to pay a subscription fee). Luckily, I stumbled upon a question posted on Stack Overflow where someone else wanted to know where they could get data. Buried in the replies was a comment from someone that noted that FlightRadar24.com aggregates crowd-sourced airline data and that you could get a current listing of plane locations in a JSON format just by querying a URL. I tried it out and was surprised to find a single wget operation returned a JSON file with the locations and stats of thousands of airplanes. The simplicity of it all was the kind of things scrapers dream about.
Cleaning the Data
I setup a simple cron job on my desktop at home to retrieve the JSON data every six minutes, and let it run from 7am-11pm over a long weekend. The fields weren't labeled in the data, so I had to do a lot of comparisons to figure out what everything meant. Fortunately, FR24's website has a nice graphical mode that lets you click on a plane and see its instantaneous stats. I grabbed some JSON data, picked out a specific flight to work with, and then compared the scraped data to the labeled fields the website gui was reporting. It was a little tricky since the stats on the website are continuously changing as the plane moves, but it was enough to identify each field in the JSON data array.
The next challenge was converting the instantaneous data into actual tracks (ie, instead of sorting by time, I wanted to sort by plane id). It was a perfect use case for Go: I wrote something that read in a day's worth of data, parsed the JSON data using an existing library, did the regrouping, and then dumped the output into a new format that would be easier for me to use (eg, one plane per line, with track points listed in a WKT linestring). The conversion reduces the 200MB of a day's data down to about 68MB of (ascii) track data. These track files are convenient for me because I can use command line tools (grep, awk, or python) to filter, group, and plot the things I want without having to do much thinking.
Running in Amazon for Free
Amazon sounded like the right place to run the scraper for longer runs. Since I hadn't signed up for AWS before, I found I qualified for their free usage tier, which lets you run a micro instance continuously for a year for free. The main limitation of the micro instance for me was storage- the instance only had about 5GB of storage, so I had to be careful about compressing the data and remembering to retrieve it off Amazon every few weeks. The latter wound up becoming a problem in November. I got tied up with Thanksgiving week and forgot to move data off the instance. The instance ran out of space and dropped data for a few weeks (during the busiest and most interesting time of year for US avionics, unfortunately). On the bright side I was able to get the previous data out of the system and restart it all without much trouble.
Below is the script I used in the instance to go fetch data. After I noticed the initial grabber was slipping by a few seconds every run, I added something to correct the sleep interval by the fetch delay.
#!/bin/bash
MIN_SECONDS_DELAY=360
URL="http://www.flightradar24.com/zones/full_all.json"

while true; do
  oldsec=`date +%s`
  mytime=`date +%F/%F-%H%M`
  mydir=`date +%F`
  wget -q $URL

  if [ ! -d "$mydir" ]; then
       mkdir $mydir
  fi
  mv full_all.json $mytime.json
  bzip2 -9 $mytime.json

  # Find how long this took to grab, then subtract from sleep interval
  newsec=`date +%s`
  gap=$((newsec - oldsec))
  left=$((MIN_SECONDS_DELAY - gap))
  if [ "$left" -gt 0 ]; then
       sleep $left
  fi
done
Migrating Data Off Amazon
The next thing I wrote was a script to repack the data on the instance. It looked at a single day and converted the data from a series of bzip'd files to a bzip'd tar of uncompressed files. Repacking gave better compression for the download and was more convenient for later use. I ran this process by hand every few weeks. Below is the script I wrote. It was a big help using date's built-in day math- I wish I'd realized earlier that you can use it to walk through date ranges in bash.
#!/bin/bash

CURRENT=$(date +%Y-%m-%d --date="1 week ago")
END=$(date +%Y-%m-%d)

# Ask the user for the beginning date
read -p "Start Date [$CURRENT] "
if [ "$REPLY" != "" ]; then
    CURRENT=$REPLY
fi

# Loop over all days since then
while [ "$END" != "$CURRENT" ]; do
    echo $CURRENT
    if [[ ! -e "out/$CURRENT.tar" ]]; then
        echo "packaging"
        tar -cvf out/$CURRENT.tar $CURRENT
    else
        echo "skipping"
    fi
    CURRENT=$(date +%Y-%m-%d -d "$CURRENT +1 day")
done
Finally, I had to write something for my desktop to go out and pull the archives off the instance. Amazon gives you an ssh key file for logging into your instance, so all I had to do was just scp the files I needed.
#!/bin/bash

HOST=ec2-user@my-long-instance-name.compute.amazonaws.com
KEY=../my-aws-key.pem

# Set range to be from a week ago, stopping before today
CURRENT=$(date +%Y-%m-%d --date="1 week ago")
END=$(date +%Y-%m-%d)

read -p "Start Date [$CURRENT] "
if [ "$REPLY" != "" ]; then
    CURRENT=$REPLY
fi

# Grab each day
while [ "$END" != "$CURRENT" ]; do
    echo $CURRENT
    if [[ ! -d "$CURRENT" ]]; then
        echo "Downloading $CURRENT"
        scp -i $KEY \
            $HOST:data/out/$CURRENT.tar downloads/
        tar xf downloads/$CURRENT.tar
        bunzip2 $CURRENT/\*.bz2
        tar cjf bups/$CURRENT.tar.bz2 $CURRENT
    fi

    CURRENT=$(date +%Y-%m-%d -d "$CURRENT +1 day")
done
While my approach meant that I had to manually check on things periodically, it worked pretty well for what I needed. By compressing the data, I found I only had to check the instance about once a month.
End of the Scraper
I turned the scraper off back in February for two reasons: FR24 started shutting down its API and my free AWS instance was expiring soon. The FR24 shutdown was kind of interesting. January 20th the interface worked, but all the flight IDs became "F2424F" and one of the the fields said "UPDATE-YOUR-FR24-APP". February 3 or so, the API stopped working altogether. Given that FR24 still has a webapp, I'll bet you can still retrieve data from them somehow. However, I'm going to respect their interface and not dig into it.